Featured This month
-
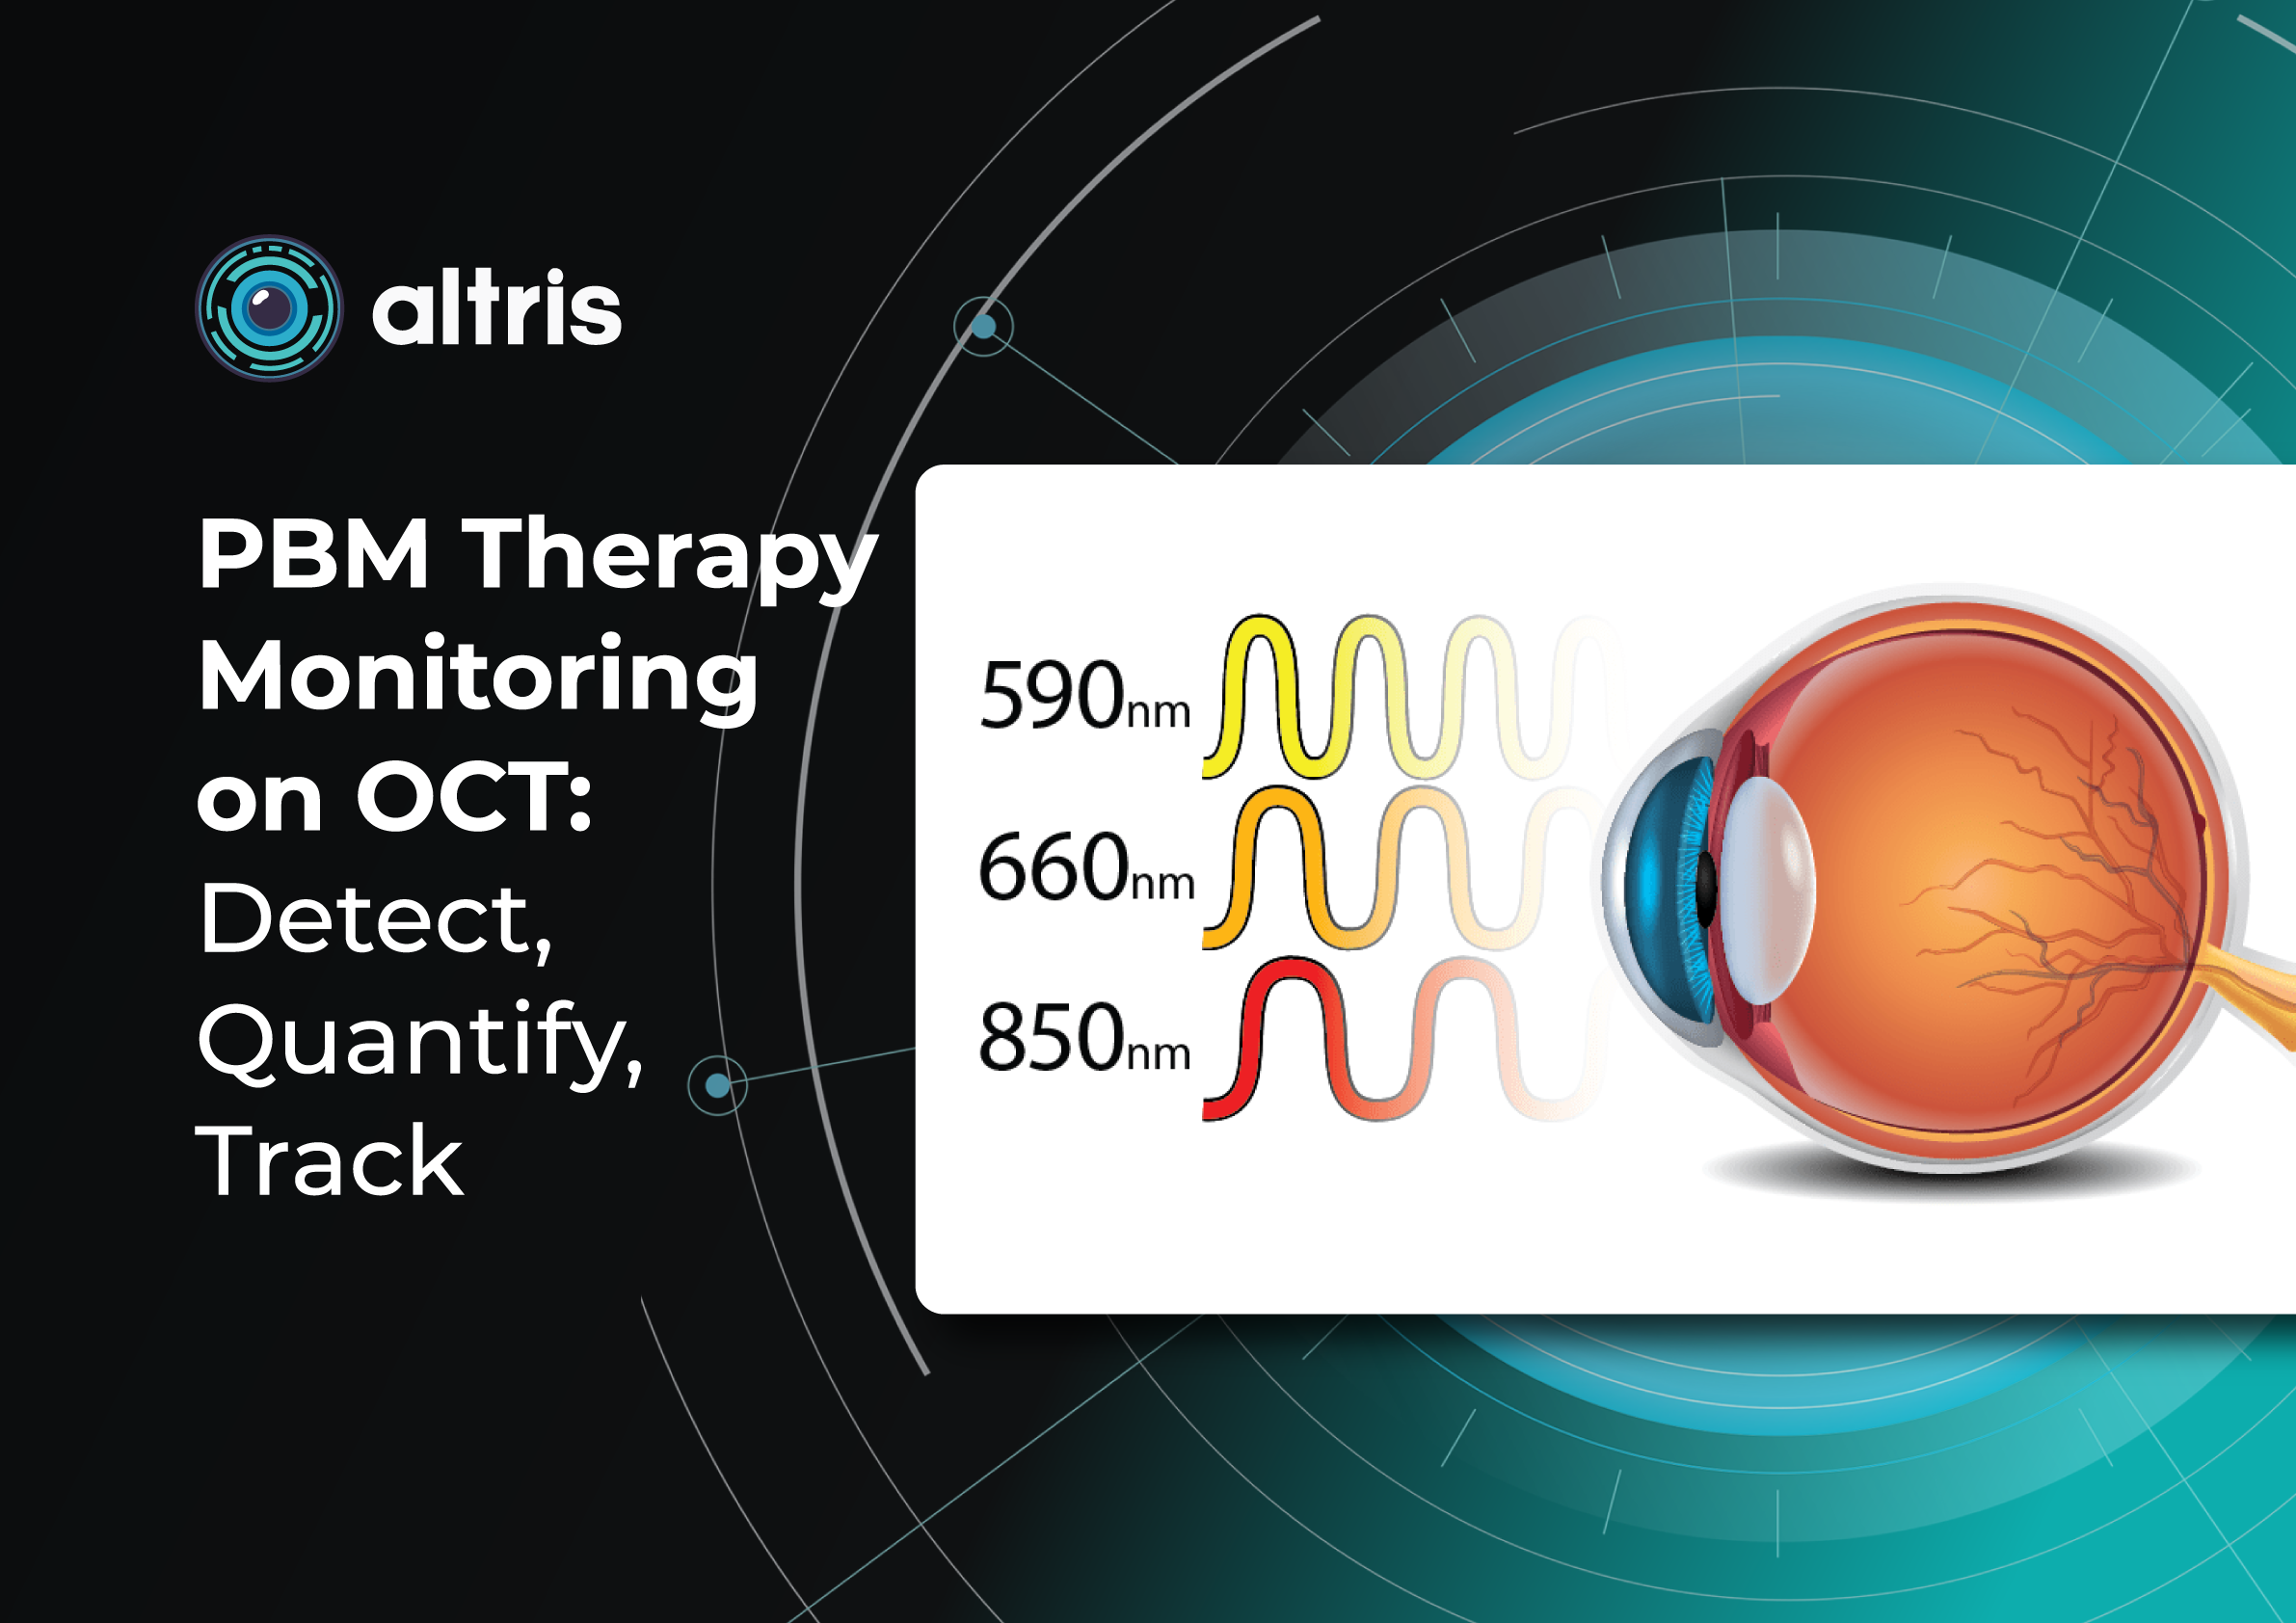
PBM Monitoring on OCT: Drusen Progression
 Maria Znamenska
5 min.
Maria Znamenska
5 min.Introduction: Role of PBM in Retinal Disease Management
Photobiomodulation (PBM), also referred to as low-level light or laser therapy, has emerged as a promising non-invasive therapeutic strategy in ophthalmology, particularly for the management of retinal diseases. PBM utilizes low-energy light in the red-to-near-infrared spectrum (typically 600–1000 nm) to modulate cellular function through photochemical rather than thermal mechanisms.
At the cellular level, PBM primarily absorbs photons from mitochondrial chromophores, most notably cytochrome c oxidase, thereby enhancing mitochondrial respiration and increasing adenosine triphosphate (ATP) production. This process is accompanied by modulation of reactive oxygen species (ROS) and activation of intracellular signaling pathways, collectively promoting cellular survival, repair, and regeneration. Importantly, PBM has also been shown to reduce oxidative stress and inflammation—two central mechanisms implicated in the pathogenesis of many retinal disorders—by decreasing pro-inflammatory cytokines and enhancing antioxidant defenses.
The retina, characterized by high metabolic demand and susceptibility to oxidative damage, represents a particularly suitable target for PBM therapy. Experimental and clinical studies have demonstrated that PBM can improve photoreceptor survival, support retinal pigment epithelium (RPE) function, and enhance overall retinal homeostasis. In animal models, PBM has been associated with preservation of retinal structure and improved electrophysiological responses, while early clinical studies suggest potential benefits for visual acuity, contrast sensitivity, and reductions in pathological features such as drusen and retinal edema.
Clinically, PBM is being explored as an adjunctive or alternative treatment for several retinal diseases, including age-related macular degeneration (AMD), diabetic retinopathy (DR), and diabetic macular edema (DME). Its advantages include a favorable safety profile, non-invasive delivery, and relatively low cost compared to conventional therapies. Furthermore, advances in light-emitting diode (LED) technology have facilitated broader clinical application by enabling safe, uniform, and cost-effective retinal illumination.
Key OCT Biomarkers to Track During PBM Therapy
Optical coherence tomography (OCT) has become an indispensable tool for monitoring retinal structure and treatment response in patients undergoing photobiomodulation (PBM) therapy. Given the mechanism of PBM—targeting mitochondrial function, reducing oxidative stress, and modulating inflammation—several OCT-derived biomarkers are particularly relevant for assessing therapeutic efficacy of dry AMD progression and in other retinal disorders. Track and quantify the following biomarkers with Altris AI:
1.PBM monitoring on OCT: Drusen Progression
For patients on photobiomodulation (PBM), OCT monitoring of drusen is about one core question: Are we stabilizing or reversing RPE–Bruch’s membrane dysfunction, or is the eye still progressing toward atrophy? So, on B-scans, drusen are seen as:
- RPE elevations (dome-shaped or irregular)
- Material between RPE and Bruch’s membrane
- Variable internal reflectivity
Here are the key drusen biomarkers to track under PBM:
- Drusen volume (MOST important)
- Measured via OCT segmentation (cube scans)
- Represents total disease burden
As the PBM goal here is the stabilization or reduction in drusen volume
Red flag:
- Continuous increase → disease progression
- Drusen height & area
- Local structural impact on photoreceptors
PBM signal:
- Flattening = potential response
- Increasing height = worsening RPE dysfunction
- Internal reflectivity
- Homogeneous vs heterogeneous content
An important nuance is that increasing heterogeneity may indicate:
- calcification
- regression OR collapse before atrophy
So, it needs to be correlated with other signs.
You may observe Drusen regression patterns. However, not all regression is good.

“Good” regression:
- Gradual flattening
- No photoreceptor loss
- Stable RPE
“Bad” regression (collapse):
- Sudden disappearance
- Followed by:
- RPE loss
- outer retinal thinning
Leads to geographic atrophy (GA)
To summarise, for PBM-treated patients, prioritize:
- Drusen volume trend (longitudinal)
- Photoreceptor integrity (EZ/ONL)
- Signs of atrophy risk (HRF, collapse patterns)
Dry AMD progression matters in PBM monitoring. PBM is currently aimed at:
- early → intermediate dry AMD
So when you monitor drusen on OCT, you’re not just tracking morphology — you’re tracking disease trajectory: Is the eye staying in intermediate AMD, or moving toward advanced stages (GA / nAMD)?
2. Central retinal thickness (CRT)
In addition to PBM monitoring on OCT: drusen progression, one of the primary biomarkers is also central retinal thickness (CRT), which reflects changes in retinal edema and overall retinal integrity. Reductions in CRT during PBM therapy may indicate decreased inflammatory activity and improved fluid homeostasis, particularly in conditions such as diabetic macular edema (DME) and neovascular retinal diseases. However, in non-exudative conditions such as dry age-related macular degeneration (AMD), CRT changes may be subtle, necessitating the evaluation of additional structural parameters.
3. The outer retinal layers
The outer retinal layers, especially the integrity of the ellipsoid zone (EZ) and external limiting membrane (ELM), represent critical biomarkers of photoreceptor health. PBM has been associated with improved mitochondrial activity within photoreceptors, and preservation or restoration of EZ continuity on OCT may serve as a surrogate marker of functional recovery. Disruptions in these layers are strongly correlated with visual impairment, making them highly relevant endpoints in PBM studies.
4. Retinal pigment epithelium (RPE)
Another key biomarker is retinal pigment epithelium (RPE) morphology, including the presence and evolution of drusen, subretinal drusenoid deposits (SDD), and RPE irregularities. PBM has been hypothesized to enhance RPE function and reduce oxidative burden, potentially leading to stabilization or regression of drusen volume over time. Quantitative drusen analysis using OCT can therefore provide insight into disease modification, particularly in intermediate AMD.
5. Hyperreflective foci (HRF)
Hyperreflective foci (HRF) are also important indicators of retinal inflammation and microglial activation. A reduction in HRF number or density during PBM therapy may reflect decreased inflammatory signaling, aligning with the known anti-inflammatory effects of light-based treatment. Similarly, subretinal and intraretinal fluid—when present—should be carefully monitored, as their resolution may indicate improved retinal barrier function and treatment response.
6. Other
Emerging OCT biomarkers include choroidal thickness and choriocapillaris integrity, which are increasingly recognized as contributors to the pathophysiology of retinal disease. PBM may influence choroidal perfusion and metabolic exchange, and changes in choroidal thickness could serve as an indirect marker of vascular and metabolic improvements.
PBM Treatment Monitoring Protocol (Step-by-Step)
1. Patient Selection and Baseline Assessment
Appropriate patient selection is critical to optimizing outcomes of photobiomodulation (PBM) therapy in dry AMD progression. Current evidence supports its use primarily in non-exudative retinal diseases, particularly intermediate Age-related Macular Degeneration, as well as emerging applications in Diabetic Retinopathy and Diabetic Macular Edema.
Inclusion considerations:
- Intermediate AMD (presence of drusen and/or subretinal drusenoid deposits)
- Stable retinal conditions without active neovascularization
- Best-corrected visual acuity (BCVA) is sufficient for functional monitoring
Exclusion criteria:
- Active neovascular AMD or significant intraretinal/subretinal fluid
- Recent anti-VEGF injections (unless PBM is used adjunctively in controlled settings)
- Significant media opacity affecting light delivery or imaging quality
Baseline evaluation should include:
- Visual function testing: BCVA, contrast sensitivity
- Structural imaging: spectral-domain OCT (mandatory)
- Optional advanced imaging: OCT angiography (OCTA) for vascular assessment
- Key OCT biomarkers (baseline reference):
-
- Central retinal thickness (CRT)
- Ellipsoid zone (EZ) integrity
- Retinal pigment epithelium (RPE) status and drusen volume
- Presence of hyperreflective foci (HRF)
Establishing a robust baseline is essential, as PBM-induced changes are often gradual and require longitudinal comparison.
2. Treatment Session Procedure
PBM is delivered using low-level light in the red-to-near-infrared spectrum (typically ~600–1000 nm), most commonly via LED-based systems designed for retinal applications.
Standard session workflow:
- Patient preparation
- No pharmacologic dilation is typically required (device-dependent)
- Proper alignment and fixation ensured
- Device application
- Light delivered trans-pupillary using controlled, non-thermal energy
- Multi-wavelength protocols (e.g., combinations of ~590 nm, 660 nm, 850 nm) are commonly used in clinical studies
- Treatment duration
- Typically, a few minutes per eye per session (device-specific)
- Sequential or simultaneous bilateral treatment, depending on the system
- Safety monitoring
- PBM is non-invasive and well-tolerated
- No significant adverse retinal effects have been reported in the current literature
- Monitor for discomfort or visual disturbances (rare)
Immediate post-session:
- No recovery time required
- Patients resume normal activities immediately
The mechanism of action—enhancing mitochondrial activity and reducing oxidative stress—does not produce immediate anatomical changes, reinforcing the need for structured follow-up.
3. Treatment Series and Frequency
PBM is not a single-session therapy for observing dry AMD progression or any other condition, but is administered as a treatment series, followed by monitoring and potential retreatment cycles.
Typical treatment regimen (based on clinical studies):
- Induction phase:
- 2–3 sessions per week
- Duration: 3–5 weeks
- Total: ~9–12 sessions per cycle
- Follow-up period:
- Reassessment at 1–3 months post-treatment
- OCT imaging to evaluate structural response
- Retreatment strategy:
- Repeat cycles every 4–6 months, depending on disease progression and response
- Individualized based on OCT biomarkers and functional outcomes
Monitoring during and after therapy:
- Short-term (during treatment):
- Limited structural change expected
- Intermediate-term (1–3 months):
- Possible reduction in drusen volume
- Stabilization of EZ and RPE integrity
- Decrease in HRF (inflammatory markers)
- Long-term:
- Disease stabilization rather than reversal is the primary goal
Outcome measures:
- Functional: BCVA, contrast sensitivity
- Structural: OCT biomarkers (drusen, EZ, CRT, HRF)
- Optional: OCTA vascular parameters
A structured PBM protocol integrates careful patient selection, standardized treatment delivery, and longitudinal OCT-based monitoring. The therapy is best suited for chronic, non-exudative retinal conditions, where its cumulative biological effects—rather than immediate anatomical changes—drive clinical benefit. Consistent imaging and biomarker tracking are essential for guiding retreatment decisions and evaluating long-term efficacy.
Devices & AI for PBM Monitoring
LumiThera (Valeda)
Valeda is a photobiomodulation (PBM) device — currently the most clinically validated retinal light therapy. Company: LumiThera (now acquired by Alcon) Mechanism (PBM):
- Uses multiwavelength light:
- ~590 nm
- ~660 nm
- ~850 nm
- Targets mitochondria → increases ATP
- Reduces:
- oxidative stress
- inflammation
- Improves retinal cellular function
Clinical positioning
- Indicated for:
- early–intermediate dry AMD
- First device to:
- demonstrate visual improvement, not just slowing the disease
Regulatory & evidence strength:
- FDA-authorized (De Novo, 2024)
- CE marked, global use
- Backed by:
- LIGHTSITE trials (I–III)
- Demonstrated:
- ~1 line BCVA improvement over 24 months
Treatment protocol
- Standard cycle:
- 9 sessions over 3–5 weeks
- Repeat:
- every 4–6 months
- Fully clinic-based
Clinical effects
- Functional:
- ↑ visual acuity
- ↑ contrast sensitivity
- Structural (OCT):
- drusen stabilization/reduction
- preservation of retinal layers
- Strong safety profile
Thus, Valeda is currently:
The only FDA-authorized retinal PBM device
The only one with phase III randomized clinical trial data (LIGHTSITE)
And it has shown actual visual acuity improvement, not just safety.Espansione
This is an ophthalmology PBM platform (incl. retina use). Espansione develops photobiomodulation (PBM / LLLT) devices specifically for eye care. Espansione is a multi-technology ophthalmic platform, not just a PBM lamp.
It combines:
- LM™ LLLT (photobiomodulation / PBM) → core tech for retina
- OPE™ IPL → only for anterior segment
Their flagship eye-light® is used for:
- anterior segment (DED, MGD)
- posterior segment (including dry AMD progression)
- It has CE approval for retinal conditions like dry AMD
- The company explicitly states expansion into posterior segment care (retina)
This is another ophthalmic PBM device platform, with retina applications.
Light characteristics
- Wavelength range: ~500–1000 nm
- Typical retina protocol:
- Yellow (~590 nm)
- Red (~625 nm)
- Delivered via LED mask over closed eyes
Mechanism (important for retina positioning)
PBM targets mitochondria:
- ↑ ATP production
- ↓ oxidative stress (ROS)
- ↑ cellular repair
- ↓ inflammation
For retina specifically:
-
Improves RPE + photoreceptor metabolism
-
Supports choriocapillaris perfusion
-
Slows degeneration processes (AMD biology)
Retina applications
- Dry AMD progression (main indication)
- CE (MDR) cleared for dry AMD (dAMD)
- Focus: early–intermediate stages (AREDS 1–3)
Clinical effects shown:
- ↑ Visual acuity (BCVA gains)
- ↓ Drusen volume
- ↑ Choriocapillaris perfusion
Thus, it is disease-modifying intent, not just symptomatic.
Typical session:
- Duration: ~10–12 minutes
- Mask-based (non-contact)
- Eyes:
- mostly closed
- brief opening phases possible
Typical course:
- ~8 sessions / 3–4 weeks (in studies)
Very different from laser or injections:
- No dilation
- No contact lens
- No invasive steps
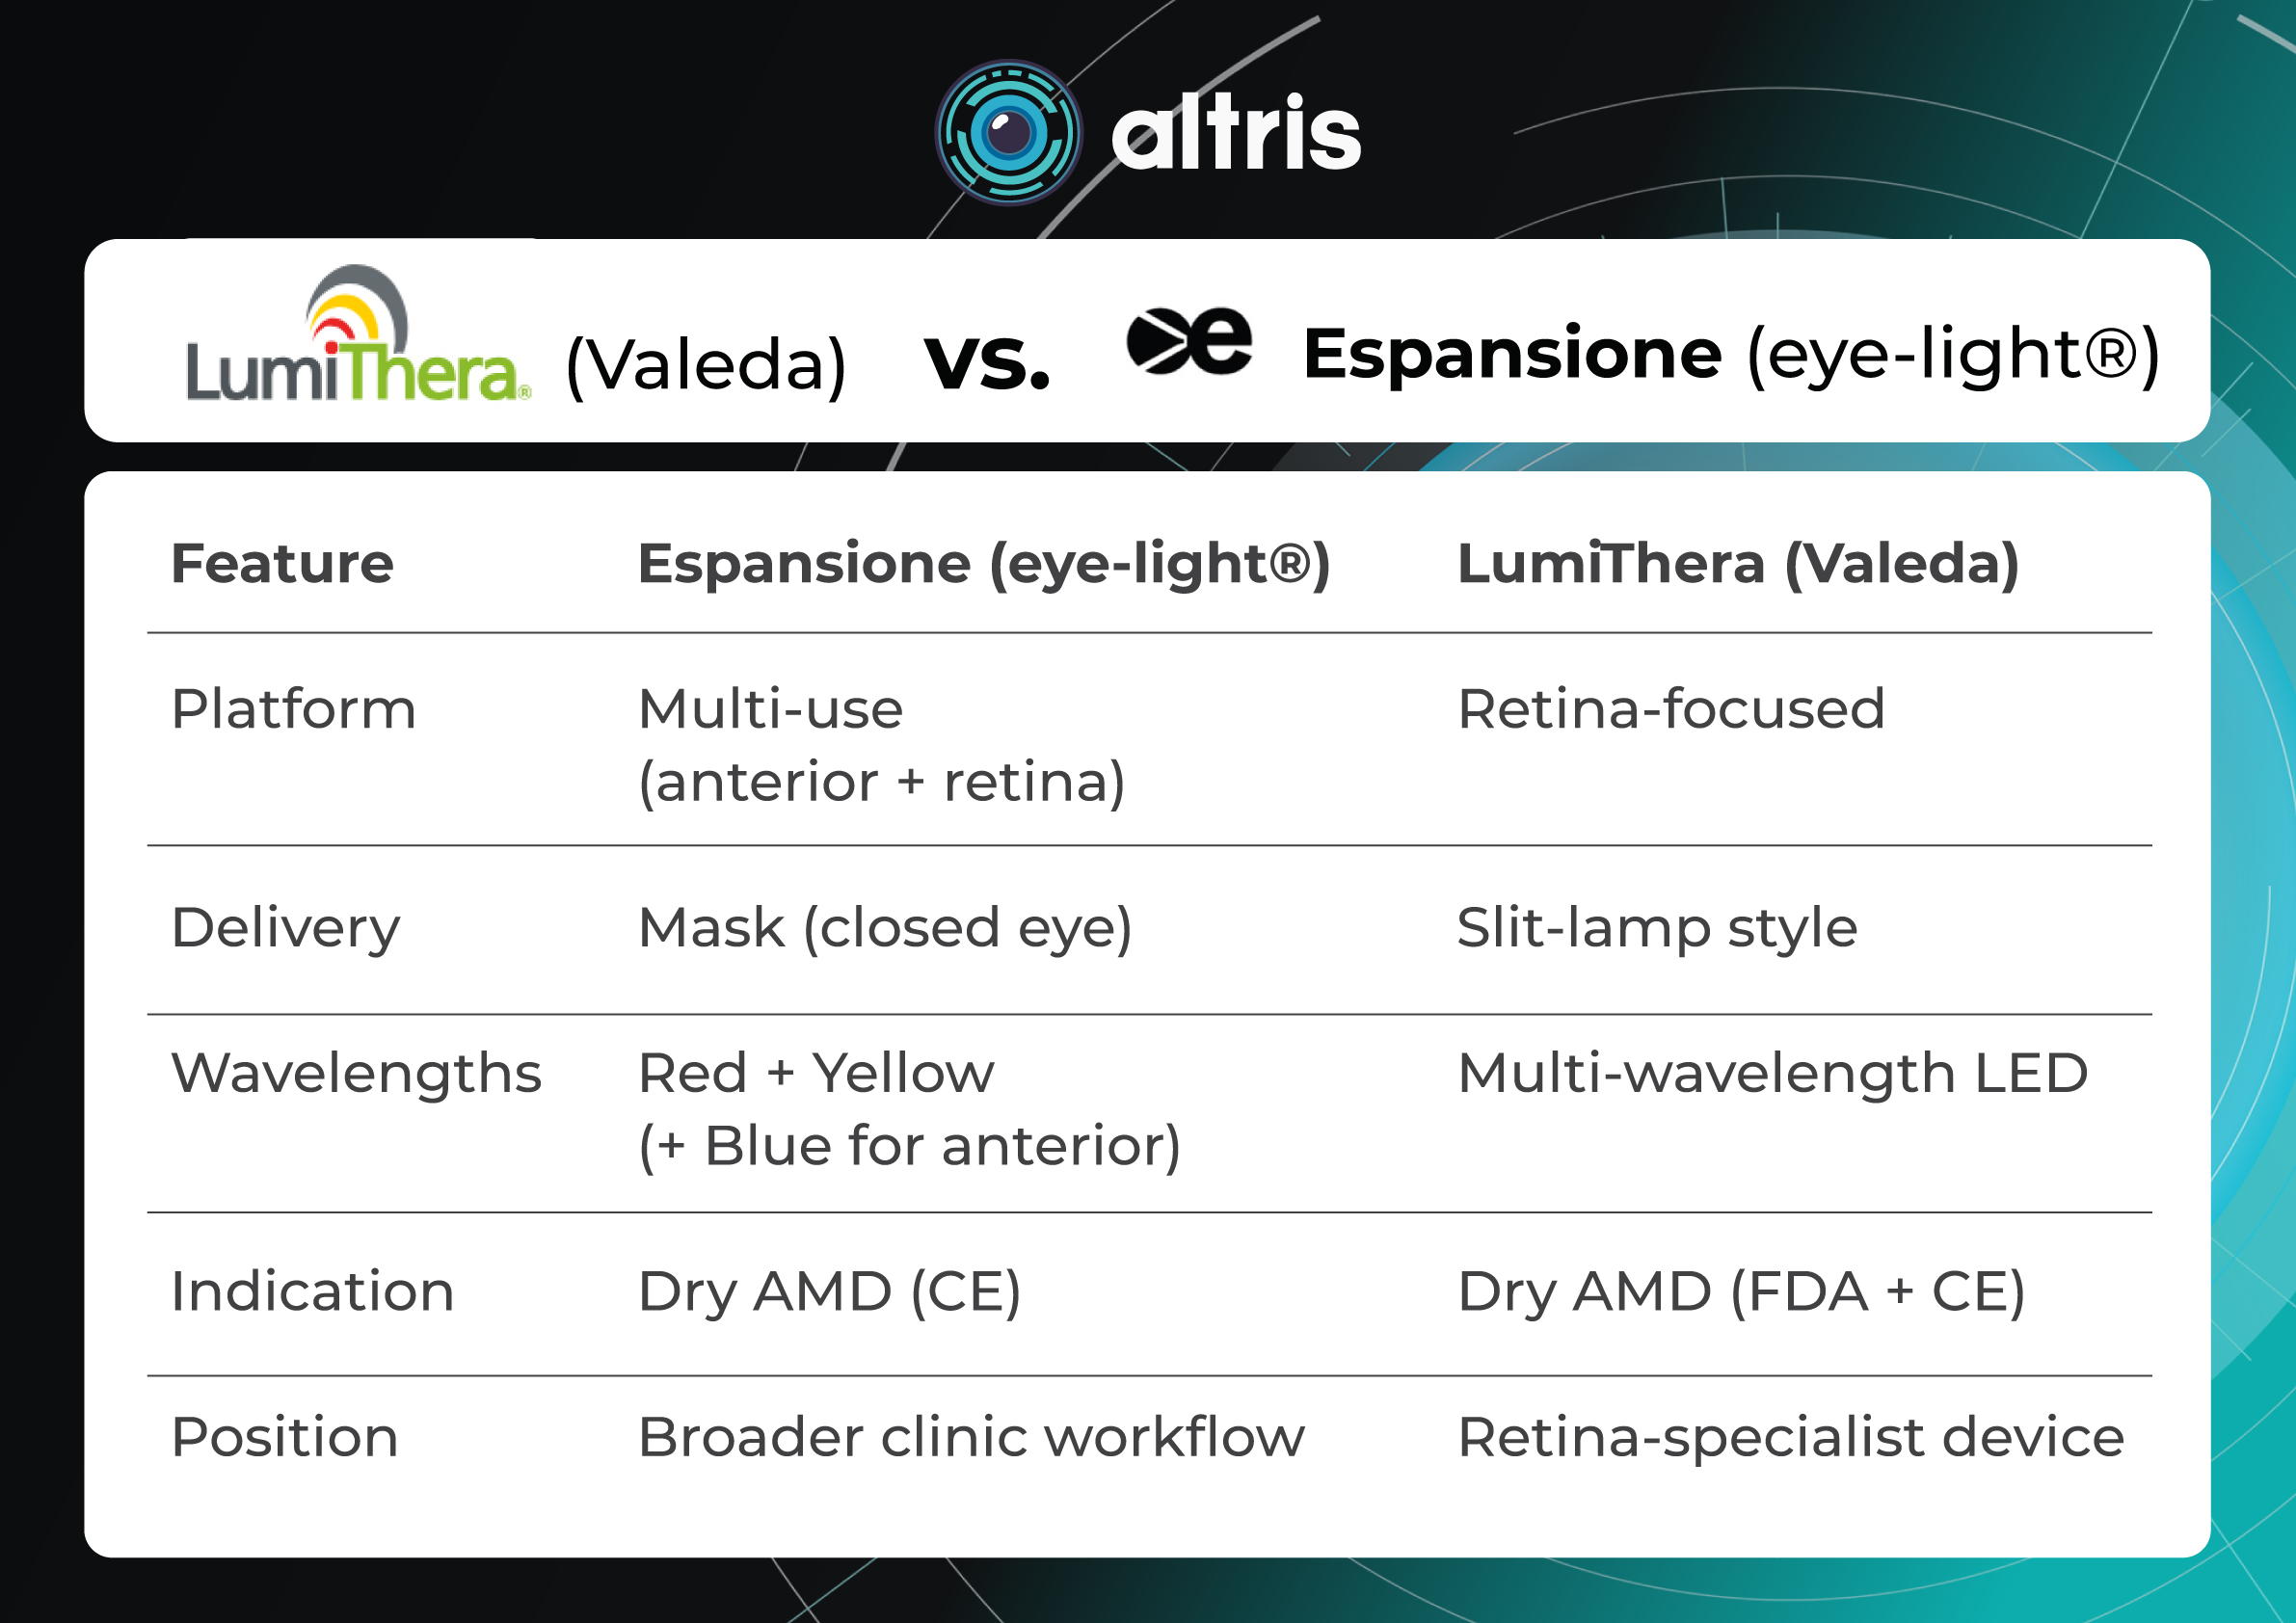
Here’s a comparison chart of the key characteristics and features of both devices:
LumiThera (Valeda) vs. Espansione (eye-light®)
Feature Espansione (eye-light®) LumiThera (Valeda) Platform Multi-use (anterior + retina) Retina-focused Delivery Mask (closed eye) Slit-lamp style Wavelengths Red + Yellow (+ Blue for anterior) Multi-wavelength LED Indication Dry AMD (CE) Dry AMD (FDA + CE) Position Broader clinic workflow Retina-specialist device Other Generic LED / Low-Level Light Therapy (LLLT) platforms
These are NOT branded retinal systems like Valeda or Espansione, but rather:
- LED arrays or laser-based PBM setups
- used in:
- early trials
- pilot studies
- lab settings
Typical characteristics:
- Wavelengths: 500–1000 nm
- Delivery:
- masks
- panels
- slit-lamp–mounted systems
Examples (non-standardized):
- custom LED rigs used in AMD studies
- early PBM prototypes before Valeda
- academic research devices
Problem:
- No standard protocol
- No regulatory approval
- Hard to compare outcomes
Experimental PBM Directions also include expanded PBM indications of
- diabetic retinopathy (DR)
- diabetic macular edema (DME)
- geographic atrophy
Next-gen PBM systems
Nevertheless, research in eye care is further exploring:
- different wavelength combinations
- dose optimization
- portable/home PBM (not validated yet)
Despite the fact that nothing close to Valeda-level evidence has emerged yet.
Modern PBM ecosystem classification
Tier 1 (validated):
- Valeda (LumiThera / now Alcon)
Tier 2 (investigational retinal PBM):
- academic LED systems
- prototype devices
Tier 3 (not true retinal PBM):
- dry eye LLLT
- cosmetic red light
- wellness devices
Clinical Application and Results
The integration of digital technologies and artificial intelligence (AI) into retinal imaging has significantly enhanced the ability to monitor treatment response in photobiomodulation (PBM) therapy. Given that PBM induces gradual, often subtle structural and functional changes, advanced analytical tools are essential for detecting and quantifying these effects with precision and reproducibility. Here are some real cases of application in Ophthalmology (Dry AMD, DME, etc).
Dry AMD
Photobiomodulation (PBM) has been clinically evaluated primarily in patients with early-to-intermediate Age-related Macular Degeneration, where no widely accepted disease-modifying therapy exists. The most robust evidence comes from the LIGHTSITE clinical trial program, in which PBM is delivered as multiwavelength light therapy (590, 660, and 850 nm) in repeated treatment cycles (typically 9 sessions over 3–5 weeks, repeated every 4 months).
Across the LIGHTSITE I–III studies, PBM has consistently demonstrated functional improvements, particularly in best-corrected visual acuity (BCVA) and contrast sensitivity, and has shown favorable safety outcomes, with no evidence of phototoxicity. In LIGHTSITE II, PBM-treated eyes showed a mean ~4-letter gain in BCVA at 9 months, with approximately one-third of patients achieving ≥5-letter improvement, while sham-treated eyes showed minimal change. Earlier studies also reported improvements in contrast sensitivity, microperimetry, and reductions in drusen burden, suggesting both functional and anatomical benefits .
More recent data from the pivotal LIGHTSITE III trial further support these findings, demonstrating statistically significant gains in visual acuity compared with sham treatment, with mean improvements exceeding 5 letters and a substantial proportion of patients achieving clinically meaningful gains. At 24 months, PBM-treated eyes showed sustained visual improvement (+6.2 letters) and a reduced progression to geographic atrophy (6.8% vs 24.0% in controls), suggesting potential disease-modifying effects.
However, despite these encouraging results, meta-analyses indicate that overall effect sizes remain modest and that variability across studies, small sample sizes, and protocol heterogeneity limit definitive conclusions regarding long-term clinical benefit. Thus, while PBM represents a promising and biologically plausible therapy for dry AMD, its role in routine clinical practice continues to evolve, with ongoing studies needed to confirm durability, optimal patient selection, and real-world effectiveness.
DME
Photobiomodulation (PBM) has been explored as a non-invasive adjunctive or alternative therapy for Diabetic Macular Edema, targeting key pathogenic mechanisms, including mitochondrial dysfunction, oxidative stress, and chronic inflammation.
Unlike anti-VEGF therapy, which primarily addresses vascular permeability, PBM aims to restore retinal metabolic balance through light-induced activation of mitochondrial pathways. Early clinical studies using red-to-near-infrared wavelengths (typically ~630–850 nm) have demonstrated reductions in central retinal thickness (CRT) and improvements in retinal morphology on OCT, alongside stabilization or modest gains in best-corrected visual acuity (BCVA). These effects are particularly notable in mild-to-moderate DME and in patients with non-center-involving edema, where PBM may reduce inflammatory signaling and improve fluid homeostasis.
Clinical data, although still limited compared to age-related macular degeneration, suggest that PBM may have value as an adjunct to standard of care, potentially reducing treatment burden in patients requiring repeated intravitreal injections. Some studies report decreased intraretinal fluid and improvement in OCT biomarkers following PBM treatment cycles, with a favorable safety profile and no evidence of retinal damage.
However, results remain heterogeneous, with variability in treatment protocols, patient populations, and outcome measures. Importantly, PBM has not yet demonstrated efficacy comparable to anti-VEGF therapy in center-involving DME, and its role is best considered complementary rather than substitutive at this stage. Larger randomized controlled trials are needed to define optimal dosing strategies, identify responder phenotypes, and clarify long-term functional benefits in DME management.
Why is OCT Critical for PBM Monitoring?
Optical Coherence Tomography (OCT) is essential for monitoring photobiomodulation (PBM) therapy because PBM aims to induce subtle, progressive structural and functional changes in the retina—especially in conditions like dry AMD progression.
Unlike anti-VEGF treatments, where effects can be more immediate, PBM outcomes are gradual and microstructural, such as changes in drusen volume, RPE integrity, outer retinal layers, and choriocapillaris perfusion. These changes are often invisible on fundus photography or visual acuity alone, making OCT the only practical tool for objective, layer-by-layer tracking over time.
Serial OCT scans allow clinicians to detect early signals of response (e.g., drusen regression or stabilization) and differentiate them from natural disease progression, which is critical for validating PBM efficacy in real-world practice.
AI-Assisted OCT Analysis
Artificial intelligence–driven analysis of optical coherence tomography (OCT) enables automated, quantitative assessment of retinal biomarkers critical to PBM monitoring. Machine learning and deep learning algorithms can segment retinal layers and identify pathological features such as drusen, hyperreflective foci (HRF), and fluid compartments with high accuracy.
In the context of PBM, AI tools provide:
- Automated retinal layer segmentation, including ellipsoid zone (EZ) and retinal pigment epithelium (RPE)
- Quantification of drusen volume and distribution, particularly relevant in Age-related Macular Degeneration
- Detection and tracking of subtle structural changes over time that may not be apparent on qualitative review
These capabilities are especially important because PBM effects are often incremental rather than dramatic, requiring sensitive longitudinal comparison.
Longitudinal Tracking and Progression Analysis
Digital platforms enable time-series analysis of OCT data, allowing clinicians to monitor the disease trajectory before, during, and after PBM therapy. Automated registration of sequential scans ensures that the same retinal locations are compared over time.
Key advantages include:
- Change detection algorithms for early identification of treatment response
- Trend analysis of biomarkers such as central retinal thickness, EZ integrity, and HRF density
- Objective progression metrics, reducing inter-observer variability
Such tools are critical for distinguishing true therapeutic effects from natural fluctuations in disease, particularly in slowly progressing conditions like dry AMD progression.
Digital tools and AI are transforming PBM monitoring by enabling precise, quantitative, and longitudinal assessment of retinal biomarkers. From automated OCT analysis to AI-driven decision support and remote monitoring, these technologies address the key challenge of PBM therapy—detecting subtle, progressive changes over time, like in dry AMD progression, etc. Their continued development will be essential for standardizing PBM protocols and optimizing patient outcomes in retinal disease management.
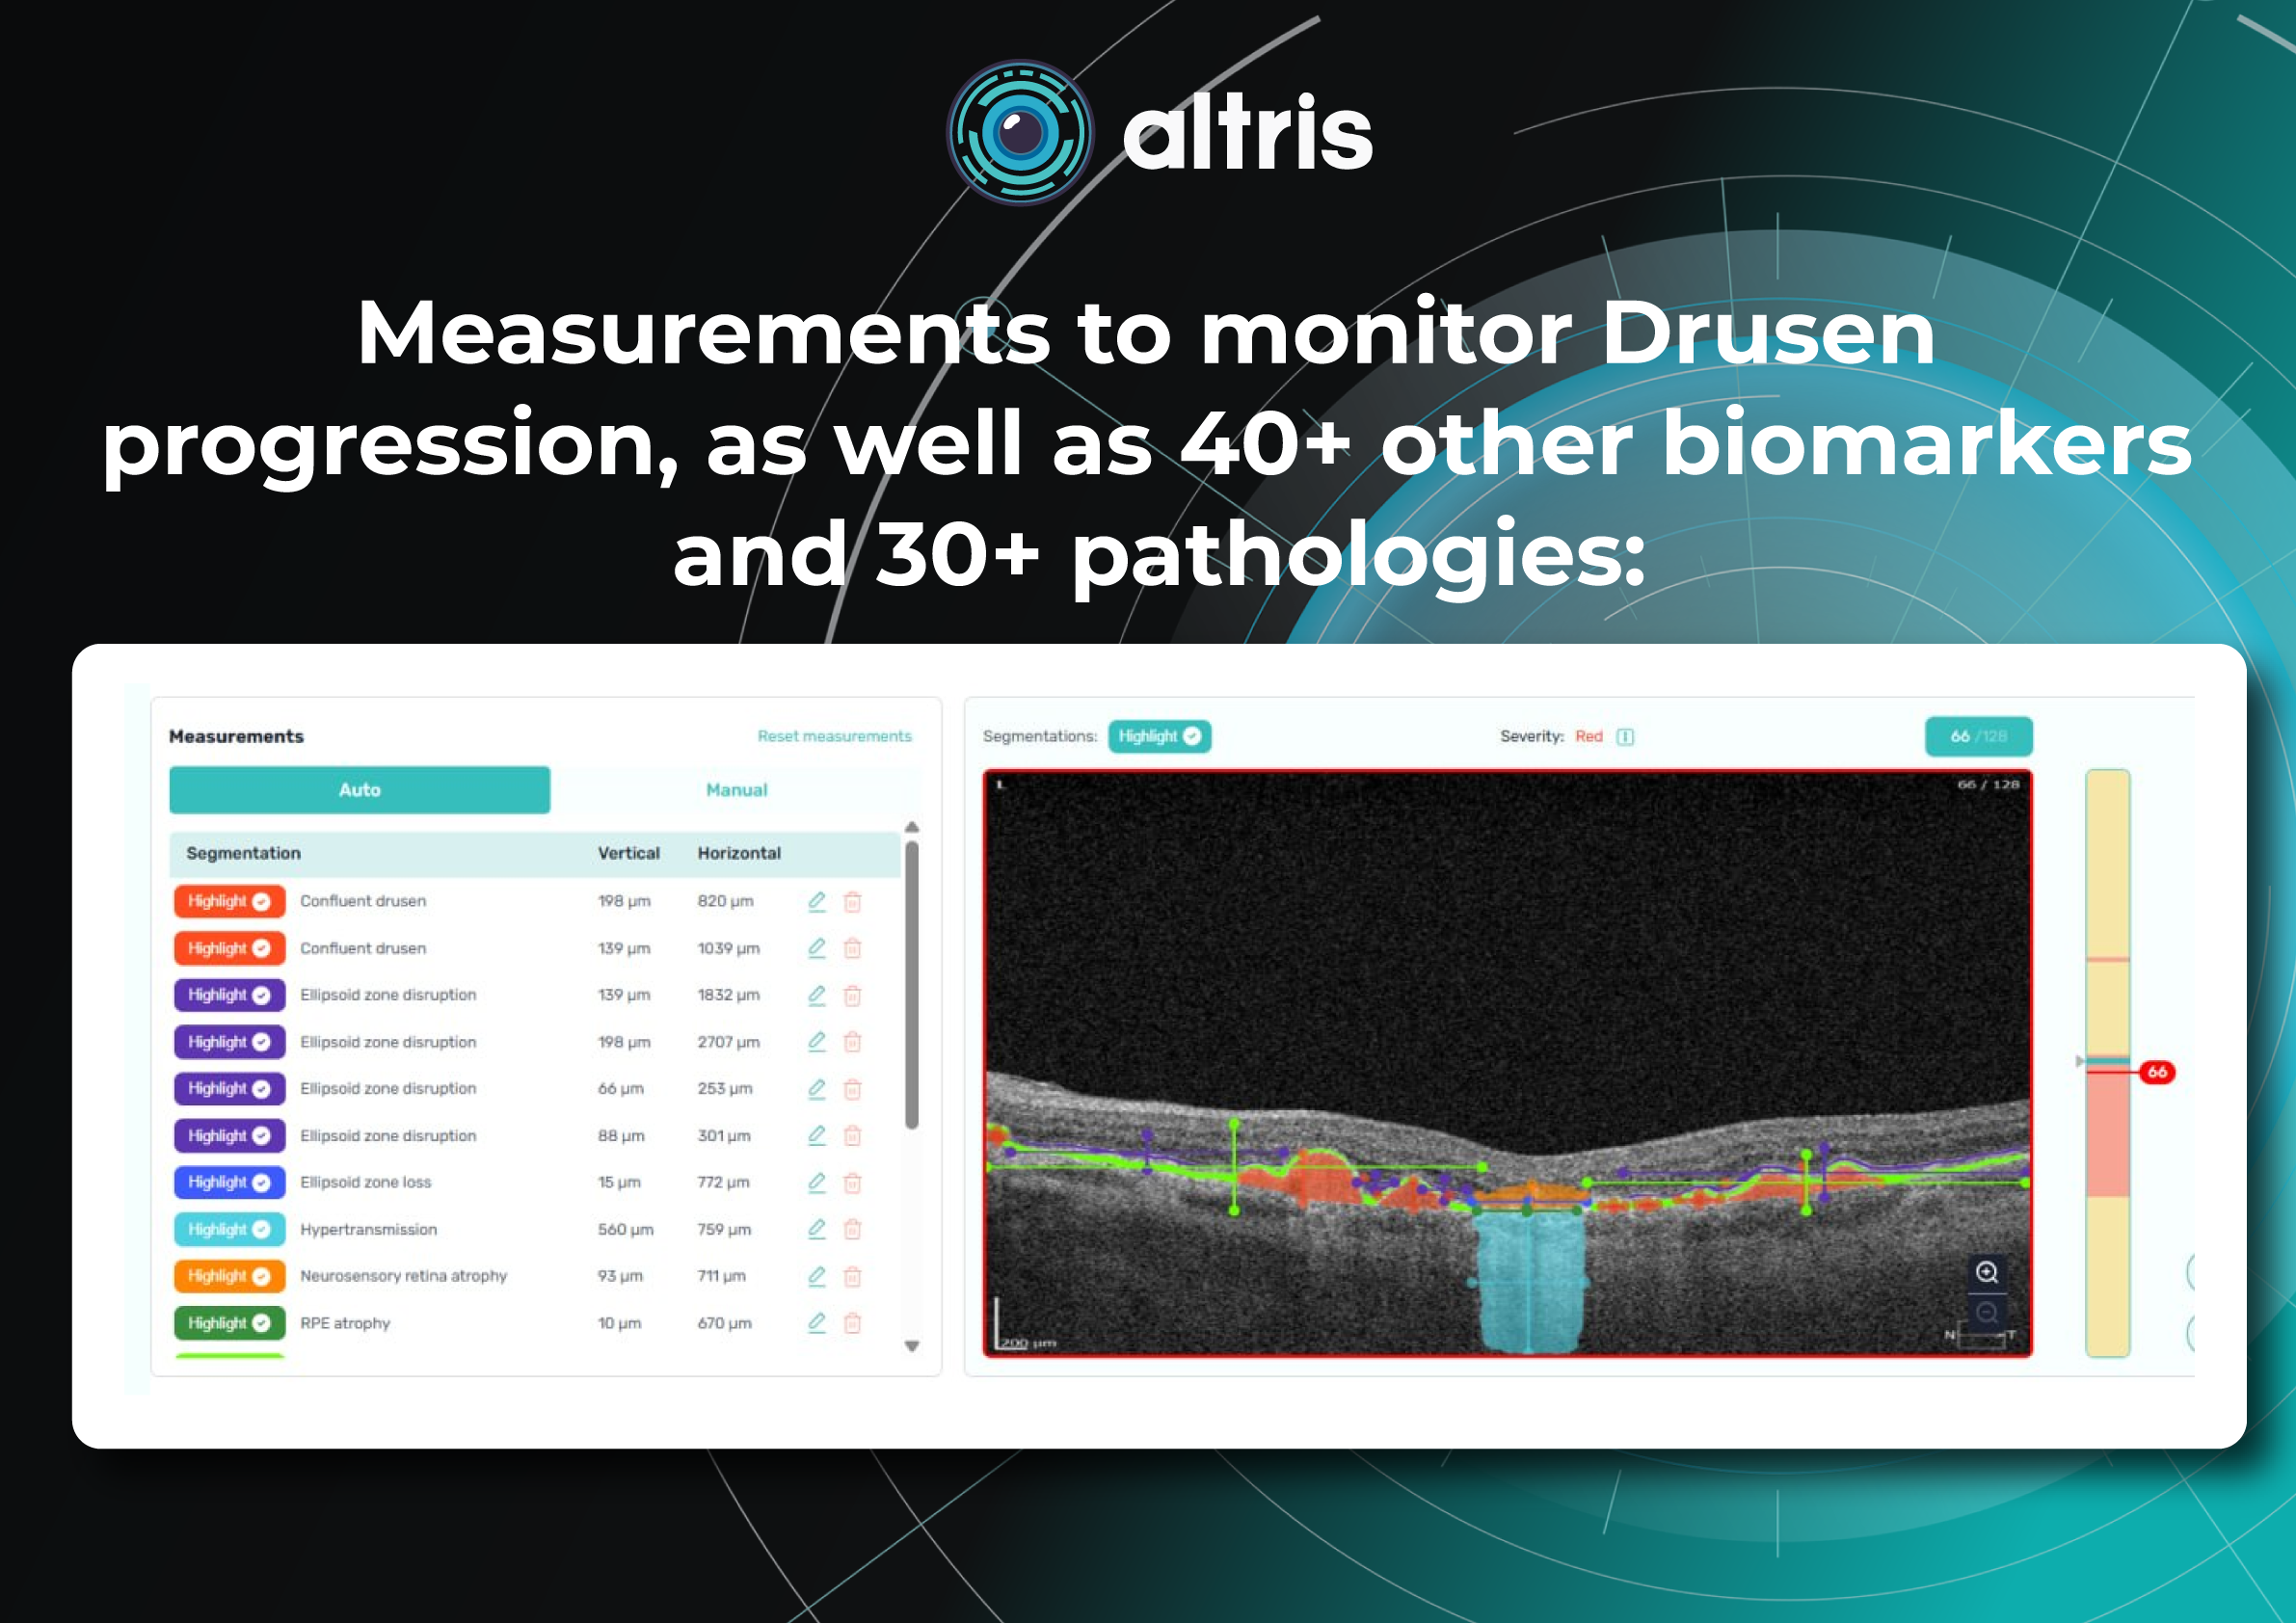
Altris AI for PBM monitoring on OCT: Drusen Progression +40 biomarkers
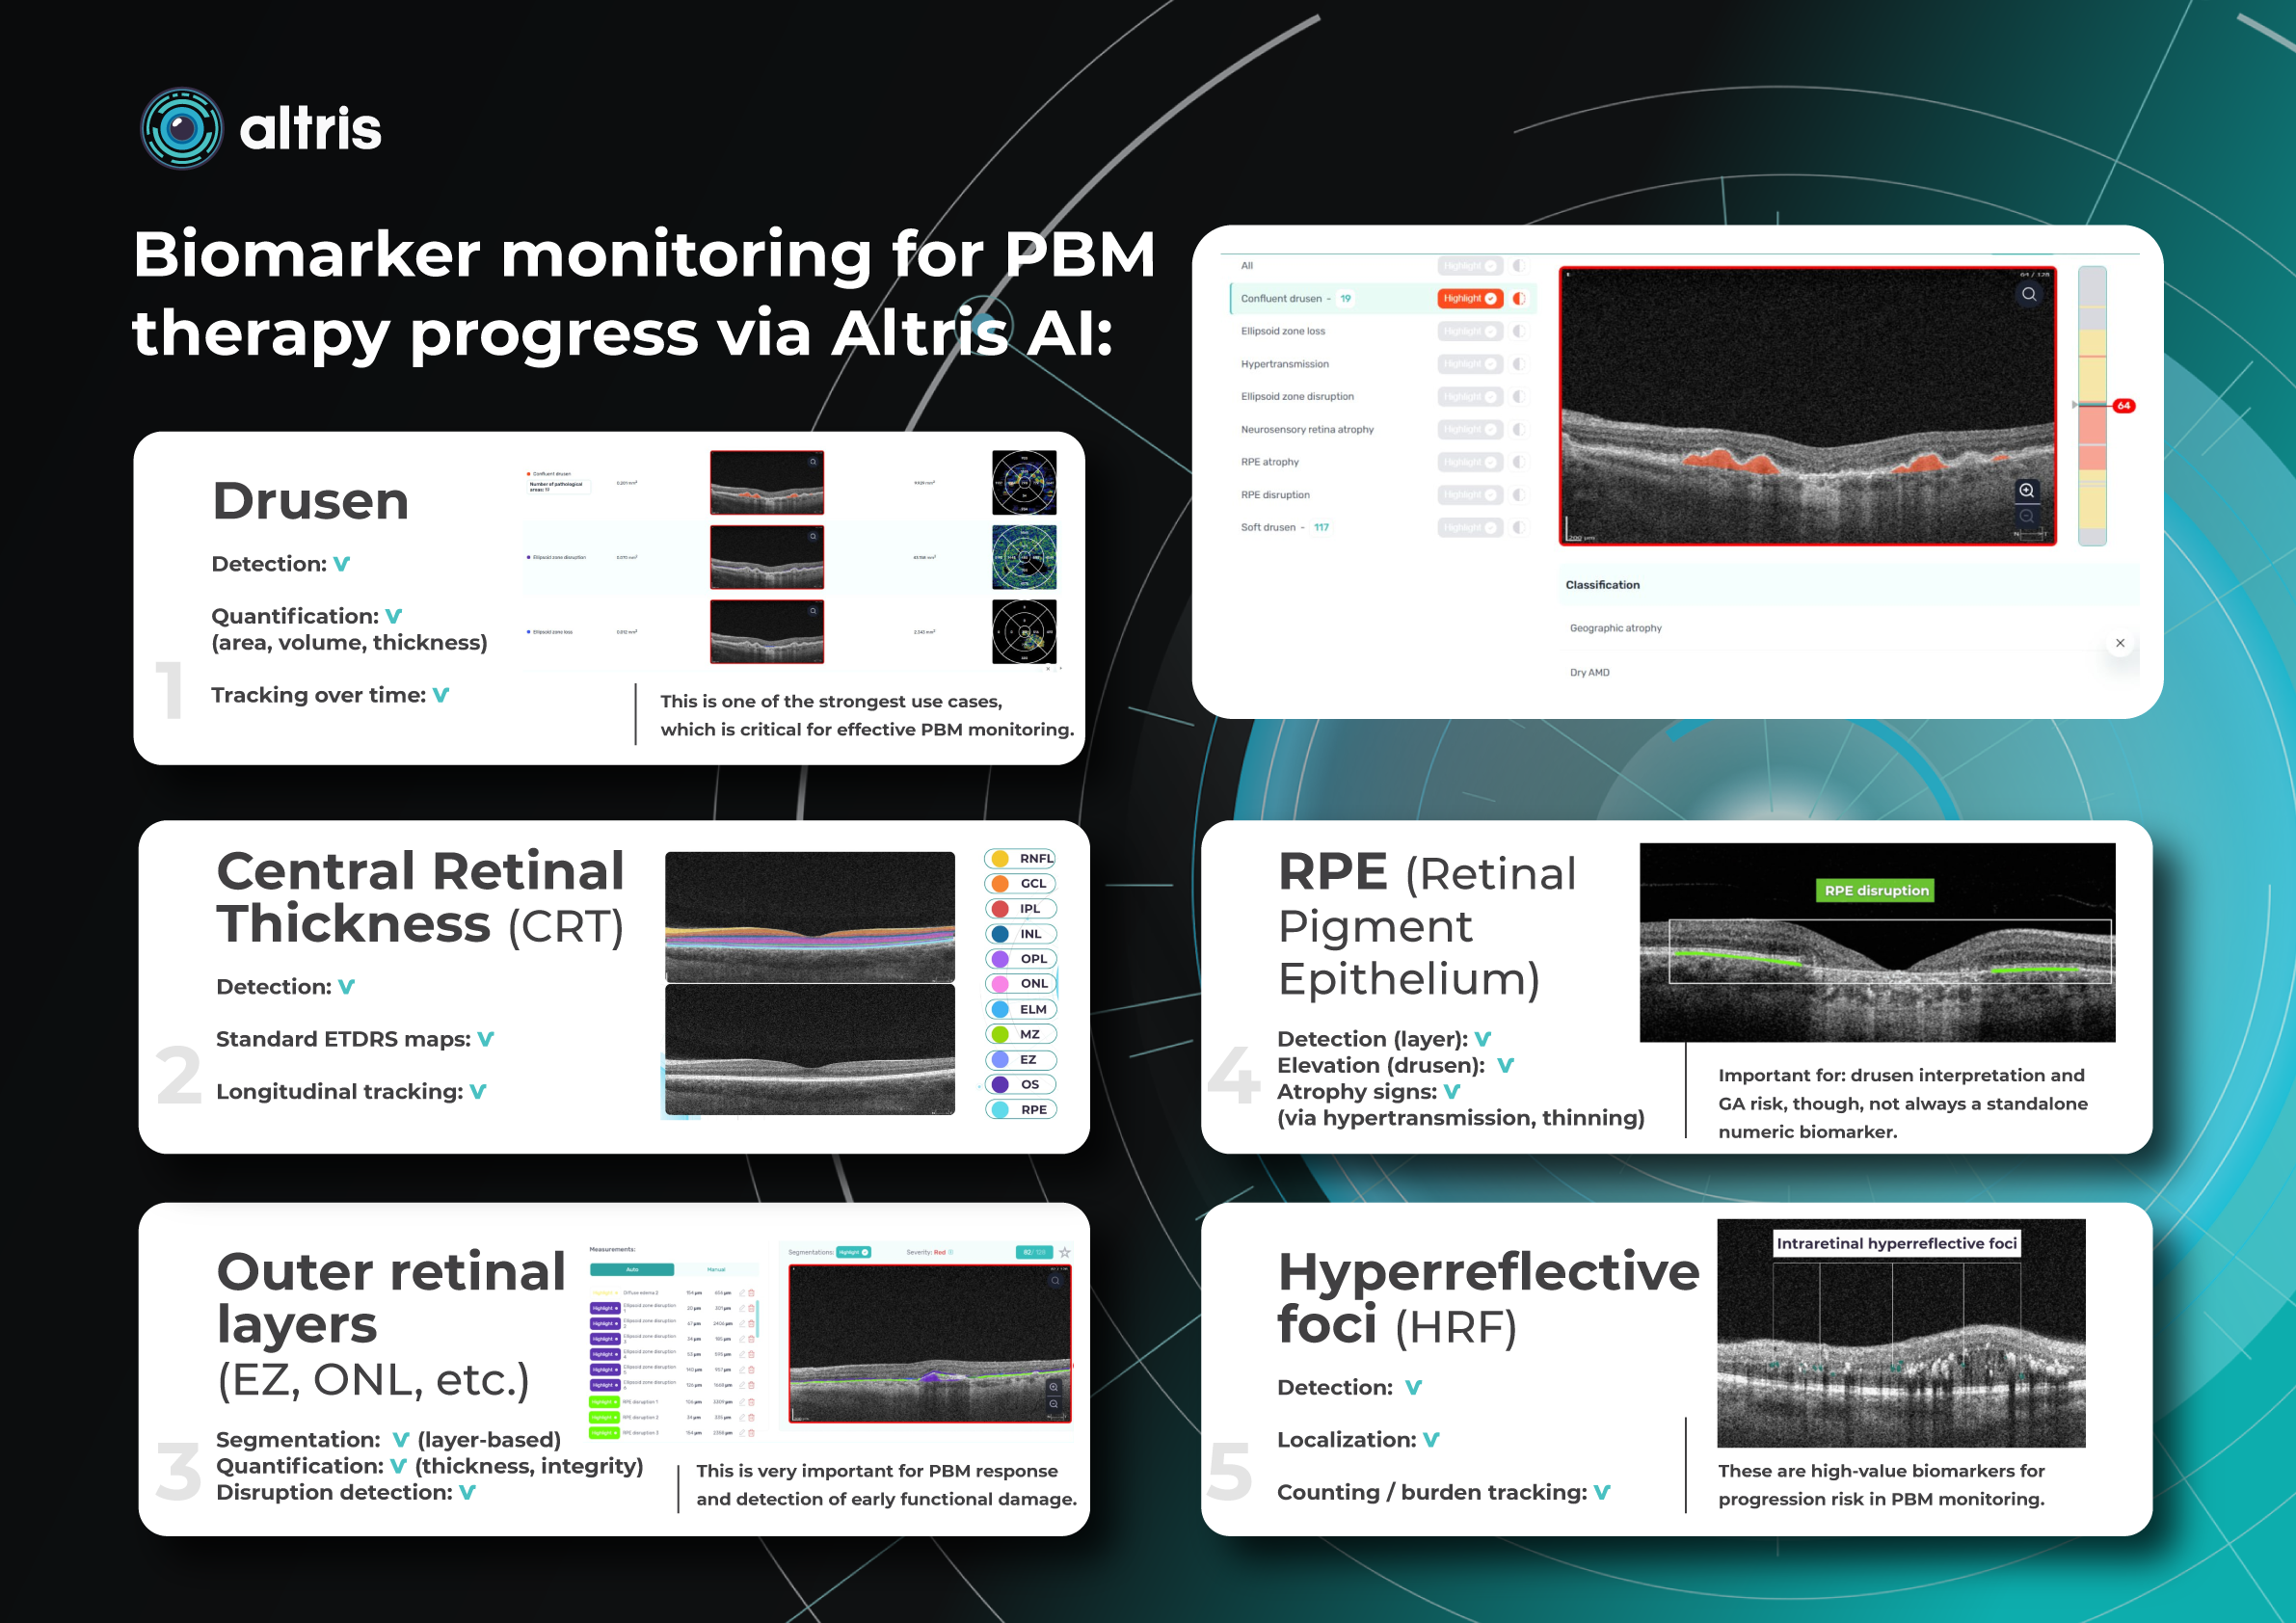
Altris AI has contributed to PBM monitoring on OCT: Drusen progression, as well as 40+ other biomarkers and 30+ pathologies, which may be monitored with the system. Altris AI enhances this process by turning OCT into a quantitative, standardized monitoring system rather than a subjective review. It automatically segments retinal layers and biomarkers (e.g., drusen, hyperreflective foci, fluid), calculates precise volumetric metrics, and enables longitudinal comparison across visits with high reproducibility. Here are the examples of biomarker monitoring cases via Altris AI:
- Drusen
Detection: ✔️
Quantification: ✔️ (area, volume, thickness)
Tracking over time: ✔️
This is one of the strongest use cases, which is critical for effective PBM monitoring.
- Central Retinal Thickness (CRT)
Detection: ✔️
Standard ETDRS maps: ✔️
Longitudinal tracking: ✔️
- Outer retinal layers (EZ, ONL, etc.)
Segmentation: ✔️ (layer-based)
Quantification: ✔️ (thickness, integrity)
Disruption detection: ✔️
This is very important for PBM response and detection of early functional damage.
- RPE (Retinal Pigment Epithelium)
Detection (layer): ✔️
Elevation (drusen): ✔️
Atrophy signs: ✔️ (via hypertransmission, thinning)
Important for: drusen interpretation and GA risk, though, not always a standalone numeric biomarker.
- Hyperreflective foci (HRF)
Detection: ✔️
Localization: ✔️
Counting / burden tracking: ✔️
These are high-value biomarkers for progression risk in PBM monitoring.
Assistance like this allows clinicians to track PBM response objectively, identify responders vs non-responders earlier, and generate consistent reports for clinical decision-making or research. In short, while OCT provides the necessary imaging depth, Altris AI unlocks its full value for PBM by making subtle retinal changes measurable, comparable, and clinically actionable.
Conclusion
PBM represents a novel and biologically plausible therapeutic modality that targets key pathological mechanisms in retinal disease. By enhancing mitochondrial function, reducing oxidative stress, and modulating inflammation, PBM holds significant potential to complement existing treatment strategies and improve outcomes in retinal disease management. However, further research is required to fully define its role in routine clinical practice.
Despite the promising findings, the clinical integration of PBM remains in an evolving stage. Variability in treatment parameters—including wavelength, dose, and treatment protocols—has limited standardization and comparability across studies. Moreover, much of the current evidence is derived from small-scale clinical trials and preclinical models, underscoring the need for large, randomized controlled trials to establish optimal treatment regimens for dry AMD progression and to assess long-term efficacy in other eye pathologies.
In this context, OCT—especially when enhanced with AI-driven analysis—plays a critical role in advancing PBM adoption. Quantitative OCT biomarkers such as drusen volume, outer retinal integrity, and subtle structural changes provide objective endpoints for assessing therapeutic response. AI-based platforms further enable precise, reproducible, and longitudinal analysis of these changes, helping to standardize evaluation, identify responders earlier, and strengthen the clinical evidence base for PBM.
FAQ Section
1. How do I objectively measure response to PBM therapy?
Clinicians look for quantifiable OCT biomarkers, not just visual acuity:
- Drusen volume (regression or stabilization)
- Outer retinal layer integrity (EZ, RPE)
- Hypertransmission / atrophy areas
The challenge: changes are subtle → require precise, longitudinal OCT comparison.
2. Which OCT biomarkers are most relevant for PBM monitoring?
The most discussed and clinically relevant:
- Drusen volume/area
- RPE atrophy
- Hypertransmission
- Ellipsoid Zone (EZ) disruption/loss
- Hyperreflective foci (secondary)
For GA specifically:
Overlap of RPE atrophy + hypertransmission + EZ loss = key composite metric.
3. How often should I monitor patients on PBM?
Typical real-world patterns:
- Baseline OCT before starting PBM
- Follow up every 3–6 months
- More frequent (monthly) in studies.
4. How do I distinguish PBM effect from natural AMD progression?
Distinguishing the effect of PBM from the natural progression of AMD remains one of the key clinical challenges. AMD typically progresses slowly and can show natural fluctuations, while PBM-related changes tend to be gradual and relatively modest. To differentiate between the two, clinicians rely on consistent OCT metrics tracked over time, comparing trends rather than single visits. Bilateral analysis—evaluating treated versus untreated eyes—can provide additional context, while assessing the rate of change, such as slowing of drusen growth or stabilization of atrophic areas, helps determine whether observed changes are likely treatment-related rather than part of the disease’s natural course.
5.Do I need AI/software for PBM monitoring, or is manual OCT review enough?
Whether AI/software is needed for PBM monitoring versus manual OCT review is an increasingly important question in clinical practice. While manual assessment can provide a general, qualitative understanding, it is often variable, time-consuming, and limited in its ability to detect subtle changes. PBM, however, requires identification of micron-level structural differences and high reproducibility across visits to accurately assess treatment response. AI-based OCT analysis addresses these challenges by enabling automated segmentation of key biomarkers, delivering precise volumetric measurements, and supporting reliable longitudinal tracking in standardized units such as mm², mm³, and percentage change. This level of consistency also helps clinicians more confidently distinguish responders from non-responders, making monitoring more objective and clinically actionable.
References:
https://pmc.ncbi.nlm.nih.gov/articles/PMC11488463/
https://link.springer.com/article/10.1007/s40135-025-00340-x
https://d-nb.info/136218389X/34
https://www.frontiersin.org/journals/ophthalmology/articles/10.3389/fopht.2024.1388602/full
https://retinatoday.com/articles/2020-may-june/photobiomodulation-as-a-treatment-in-dry-amd
https://espansionegroup.it/it/
-
Geographic Atrophy Retina OCT Biomarkers: Detection, Quantification, and Monitoring
Maria Znamenska
5 min.Introduction. Overview of Geographic Atrophy (GA) as a Late Stage of Dry AMD
Geographic atrophy (GA) is a chronic progressive retinal degeneration that represents part of the late stage of age-related macular degeneration (AMD). It is characterized by gradual and irreversible atrophy of photoreceptors, the retinal pigment epithelium (RPE), and the choriocapillaris. As a result, a persistent defect of neurosensory tissue develops, which clinically manifests as central vision loss, the appearance of central scotomas, and reduced contrast sensitivity.
Atrophic lesions typically originate in the outer retinal layers and gradually expand, involving the macula and fovea. Over time, this leads to irreversible visual impairment and a significant decline in quality of life. In the early stages, patients may not experience noticeable changes in visual acuity. However, involvement of the central foveal region may lead to a sudden functional deterioration, with patients reporting difficulties in reading, recognizing faces, and working with fine details.
GA is considered one of the leading causes of clinically significant central blindness among people over the age of 60 in developed countries. With the aging population, the prevalence of this condition continues to increase, creating a substantial social and economic burden. In addition to reduced visual acuity, GA significantly affects patients’ quality of life.
Geographic atrophy retina OCT, together with modern digital image analysis algorithms, has become a key tool in the diagnosis, monitoring, and evaluation of OCT biomarkers predicting GA progression. OCT provides cross-sectional imaging of the retina with microscopic resolution, enabling detailed assessment of individual retinal structures—from the inner retinal layers to the RPE–Bruch’s membrane–choriocapillaris complex. This technology has enabled the transition from subjective ophthalmoscopic assessment to objective structural analysis.
The advantages of OCT in the diagnosis and monitoring of GA include its non-invasive nature, high reproducibility, ability to detect early structural changes, and accurate quantitative measurements. Structural alterations at the level of photoreceptors and the RPE often occur long before they become visible on ophthalmoscopy or fundus photography. Proper recognition of OCT biomarkers of GA is essential not only for disease diagnosis but also for personalizing treatment strategies, predicting the risk of progression, and evaluating therapeutic outcomes.
The purpose of this article is to summarize current scientific evidence on OCT biomarkers of geographic atrophy, including their morphological definition, quantitative parameters, prognostic significance, and role in monitoring disease progression. Particular attention will be given to the practical aspects of OCT in clinical practice, interpretation of longitudinal changes, and effective communication with patients regarding the expected course of the disease.
2. Main OCT Biomarkers of Geographic Atrophy
Modern understanding of GA morphology has been largely shaped by the work of international expert groups, particularly the Classification of Atrophy Meetings (CAM) Group. The CAM group proposed standardized terminology and clear OCT-based criteria for retinal atrophy, enabling harmonization of diagnostic approaches in both clinical practice and multicenter studies.
The CAM group recommends spectral-domain OCT (SD-OCT) as the preferred imaging modality for detecting GA-related changes, as it allows identification of the earliest signs of developing atrophy.
2.1 OCT Signs of Geographic Atrophy
The following three features form the basis for the standardized OCT definition of GA:
- Loss of the outer retina
- Loss of the retinal pigment epithelium (RPE) ≥250 µm in diameter
- Choroidal hypertransmission ≥250 µm in diameter
1. Loss of the Outer Retinal Layers
On OCT B-scans this manifests as:
- disruption or loss of the ellipsoid zone (EZ)
- absence of the interdigitation zone
- thinning or complete loss of the outer nuclear layer (ONL)
- thinning (atrophic changes) of the neuroepithelium above the lesion
This feature reflects the loss of photoreceptors, which are the primary functional elements responsible for central vision.
2. Loss of the Retinal Pigment Epithelium (RPE)
The CAM group established a threshold of 250 µm in the largest horizontal dimension to define clinically significant atrophy.
AI detection of RPE atrophy OCT appears as:
- absence or severe thinning of the hyperreflective RPE band
- a well-defined border between preserved and atrophic RPE
3. Choroidal Hypertransmission
Due to the loss of the RPE, light penetrates more deeply into the underlying layers, resulting in increased visualization of the choroid.
On OCT this appears as:
- Increased visibility of the choriocapillaris layer
- Clear correspondence with the area of RPE defect
Classification of Outer Retinal Atrophy Associated with AMD
- Complete RPE and outer retinal atrophy (cRORA)
- Incomplete RPE and outer retinal atrophy (iRORA)
- Complete outer retinal atrophy (cORA)
- Incomplete outer retinal atrophy (iORA)
2.2 OCT Parameters for Monitoring Geographic Atrophy
Once the diagnosis is established, OCT biomarkers predicting GA progression and quantitative monitoring of disease progression becomes critical.
1. Morphological Triad
RPE atrophy, choroidal hypertransmission, and neuroepithelial atrophy represent the hallmarks of complete retinal atrophy.
This triad defines retinal atrophy within the lesion area and allows differentiation between complete and incomplete atrophy using structural criteria.
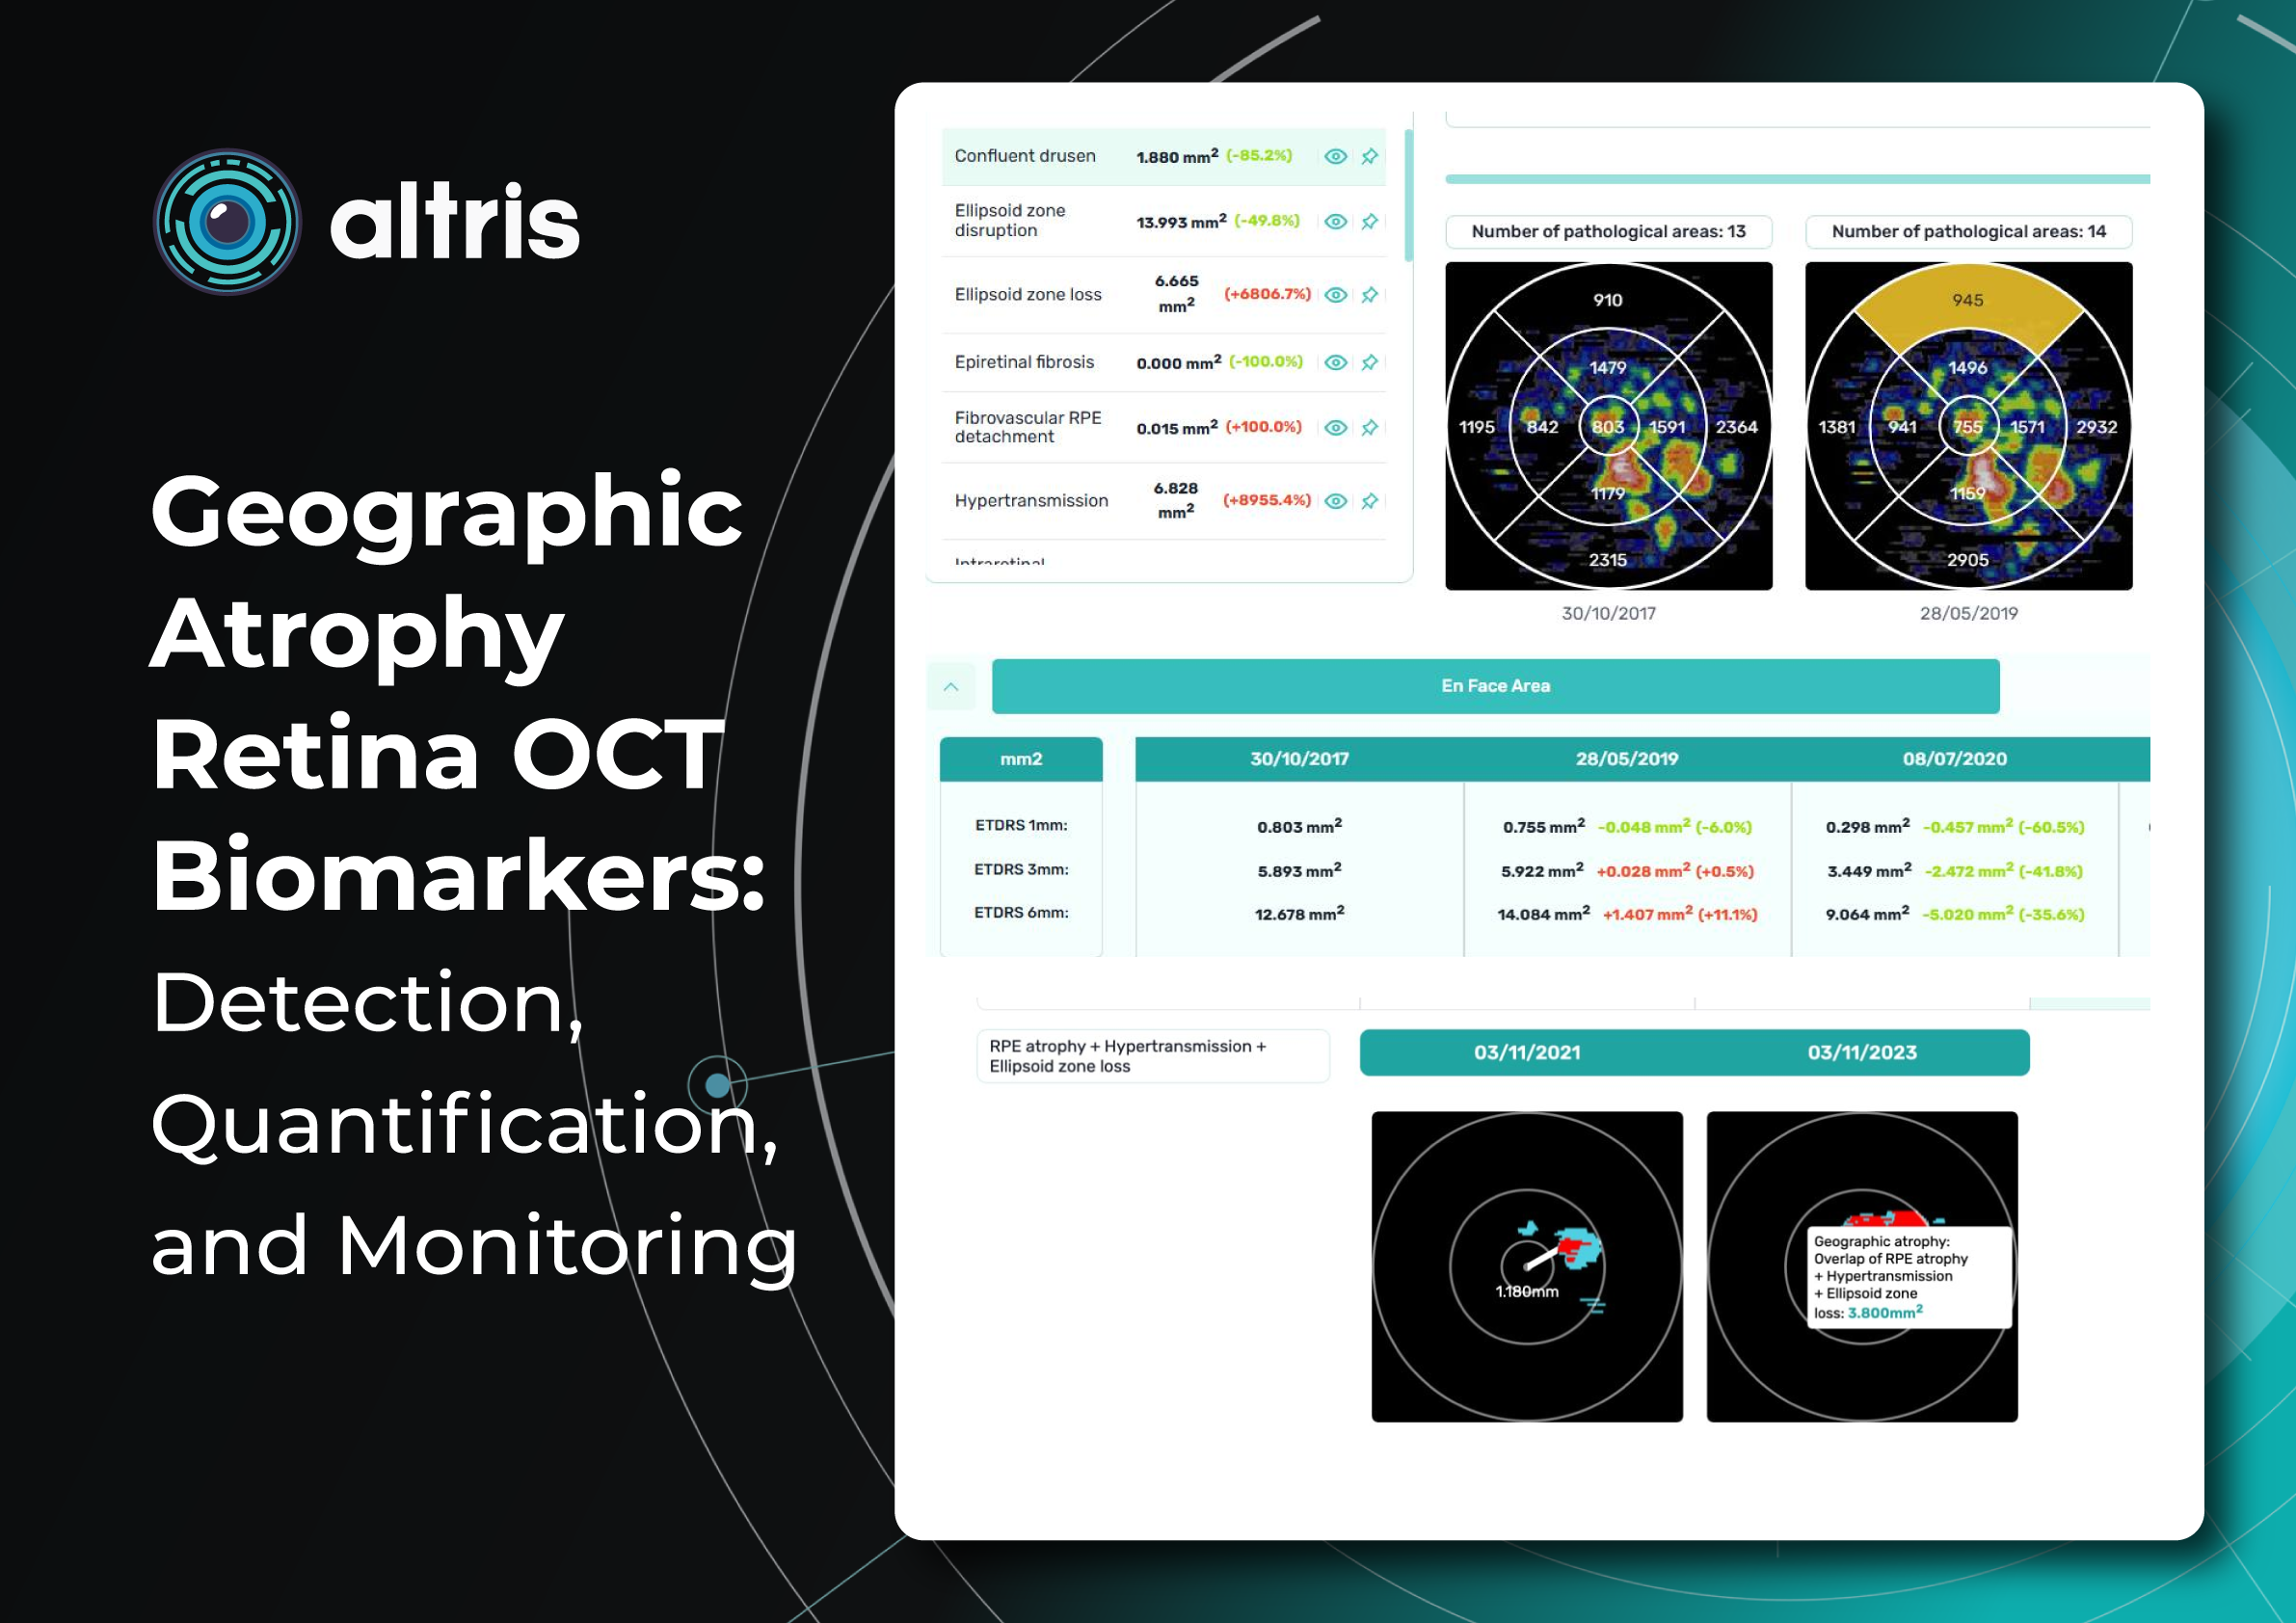
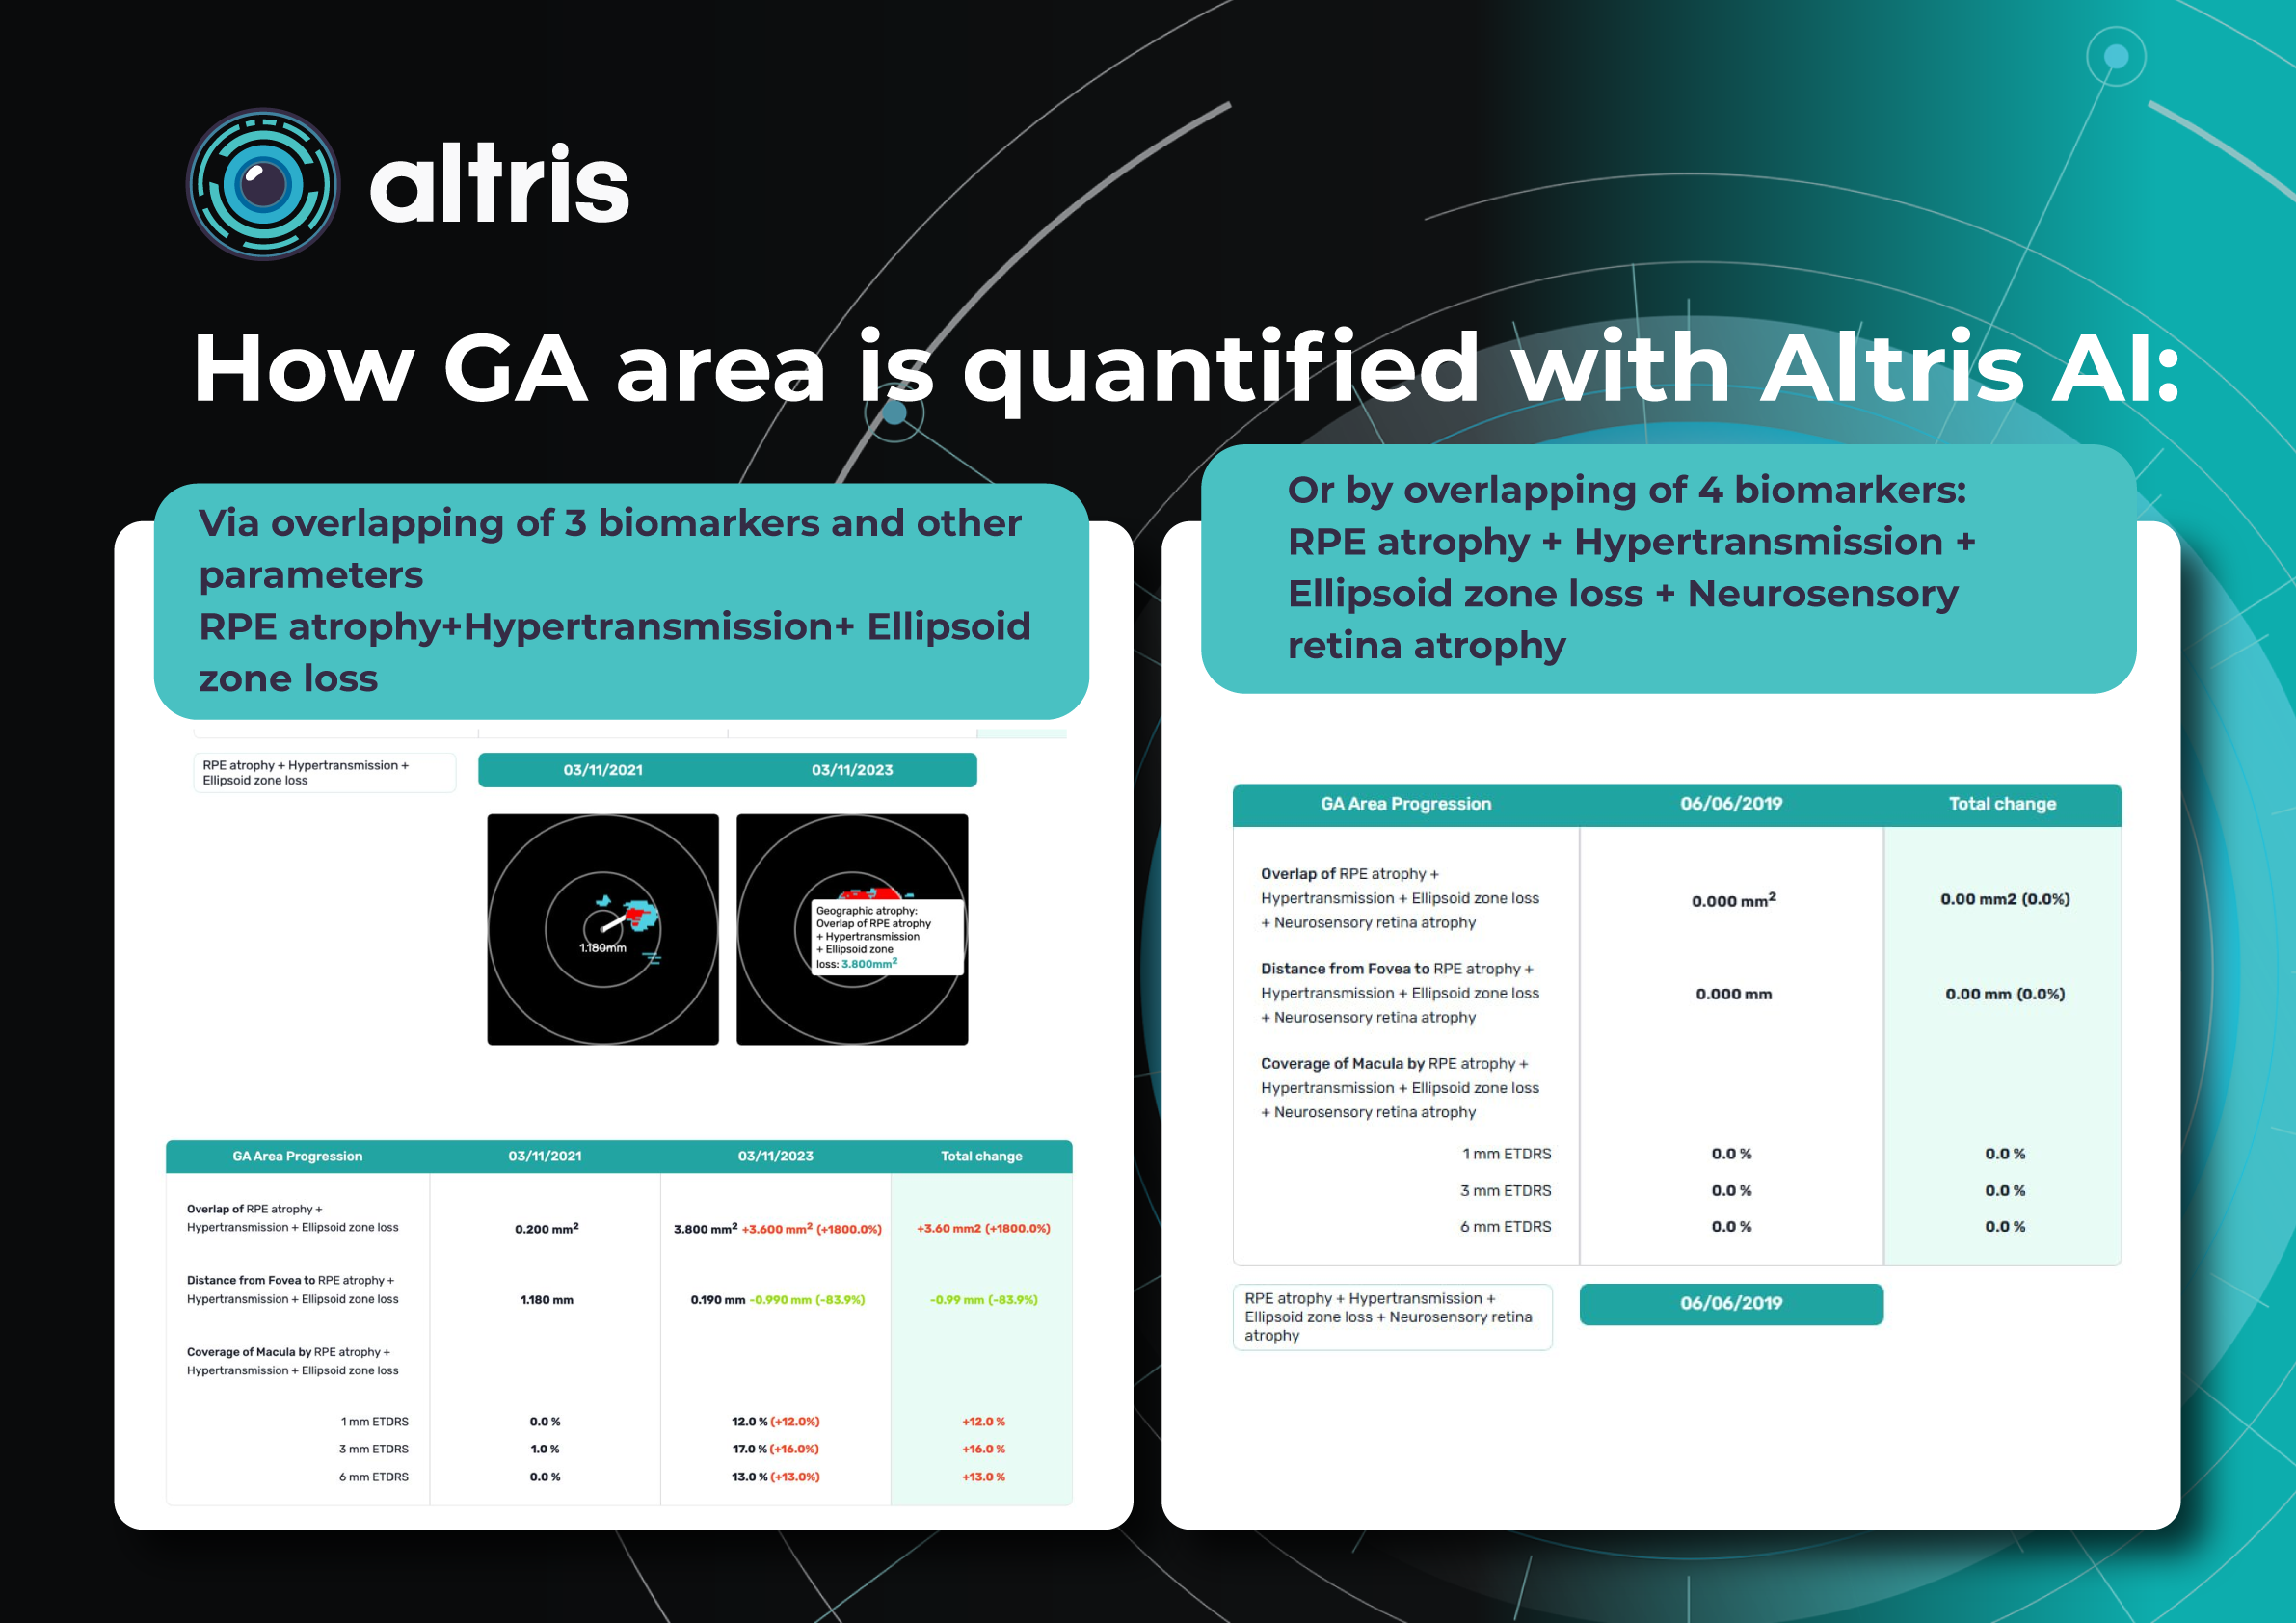
2. Area of Geographic Atrophy (mm²)
Quantitative measurement of GA area is a key parameter in both clinical practice and research.
OCT segmentation enables highly reproducible calculation of the affected area. Modern OCT systems allow:
- automatic segmentation of atrophy boundaries
- calculation of the GA area in mm²
- comparison of measurements between visits
The annual enlargement rate of the GA area is an objective marker of disease progression and correlates with functional visual outcomes. Importantly, the GA area may increase even when visual acuity remains stable.
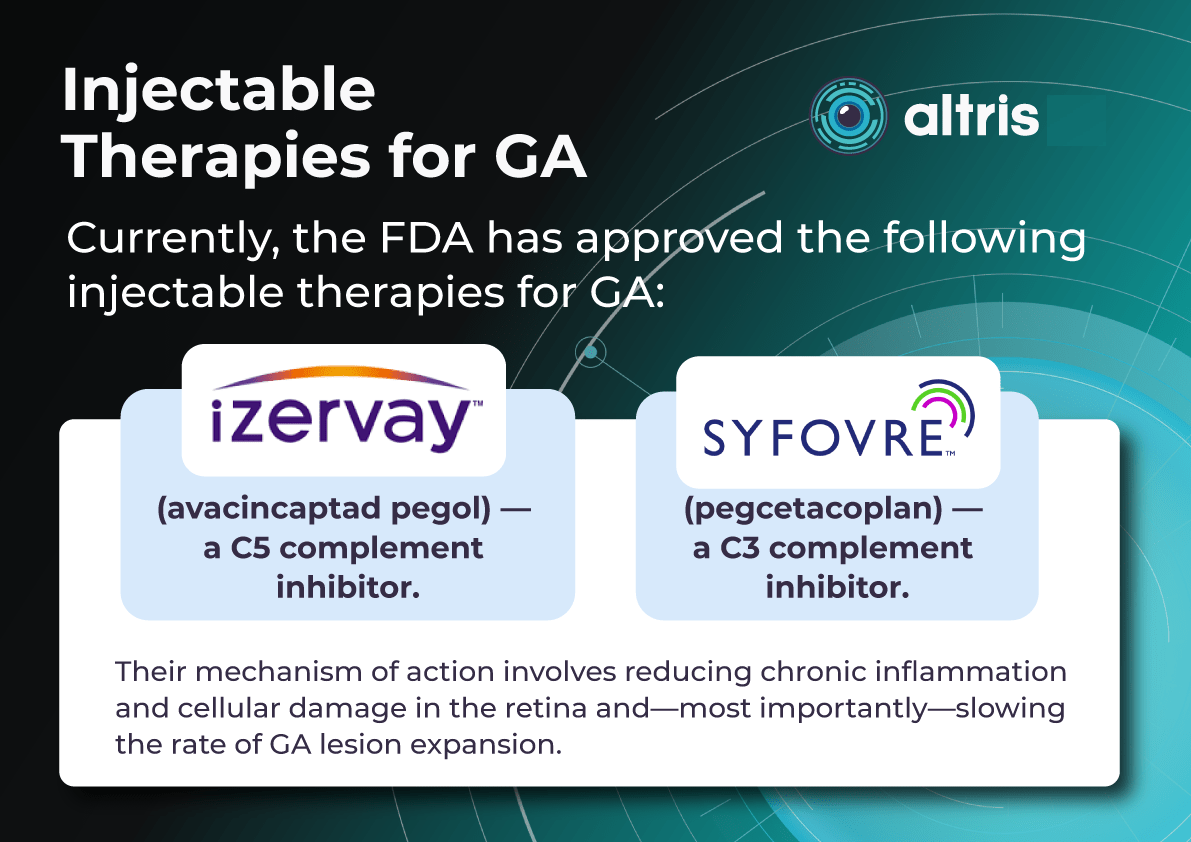
The area of GA served as the primary endpoint in clinical trials evaluating the intravitreal therapies Syfovre and Izervay, which were recently approved by the FDA as treatments to slow GA lesion growth.
AI-based algorithms further improve the precision and reproducibility of measurements, which is particularly important for long-term monitoring.
Modern OCT systems provide GA area measurements in mm², and comparisons between visits provide an objective measure of disease dynamics. Even when patients do not perceive changes, increasing lesion area confirms disease progression.
3. Distance Between GA Lesions and the Fovea
An important quantitative parameter is the distance between the foveal center and the nearest border of the atrophic lesion.
This parameter has direct functional significance. Decreasing distance over time correlates with declining visual function: the closer GA approaches the fovea, the higher the risk of sudden vision loss.
Patients with GA lesions approaching the fovea have a poorer prognosis and often require more intensive monitoring and therapeutic interventions.
This parameter also allows objective risk prediction and supports:
- early referral to specialized ophthalmology centers
- discussion of potential vision loss with patients
2.3 Predictors of GA Development and Progression
GA frequently develops as a consequence of drusen involution or structural alterations of the RPE.
GA lesions in AMD may arise in association with:
- certain drusen types (large or confluent drusen, reticular pseudodrusen)
- previous choroidal neovascularization
- RPE detachment or RPE tear
- refractile deposits
- vitelliform lesions
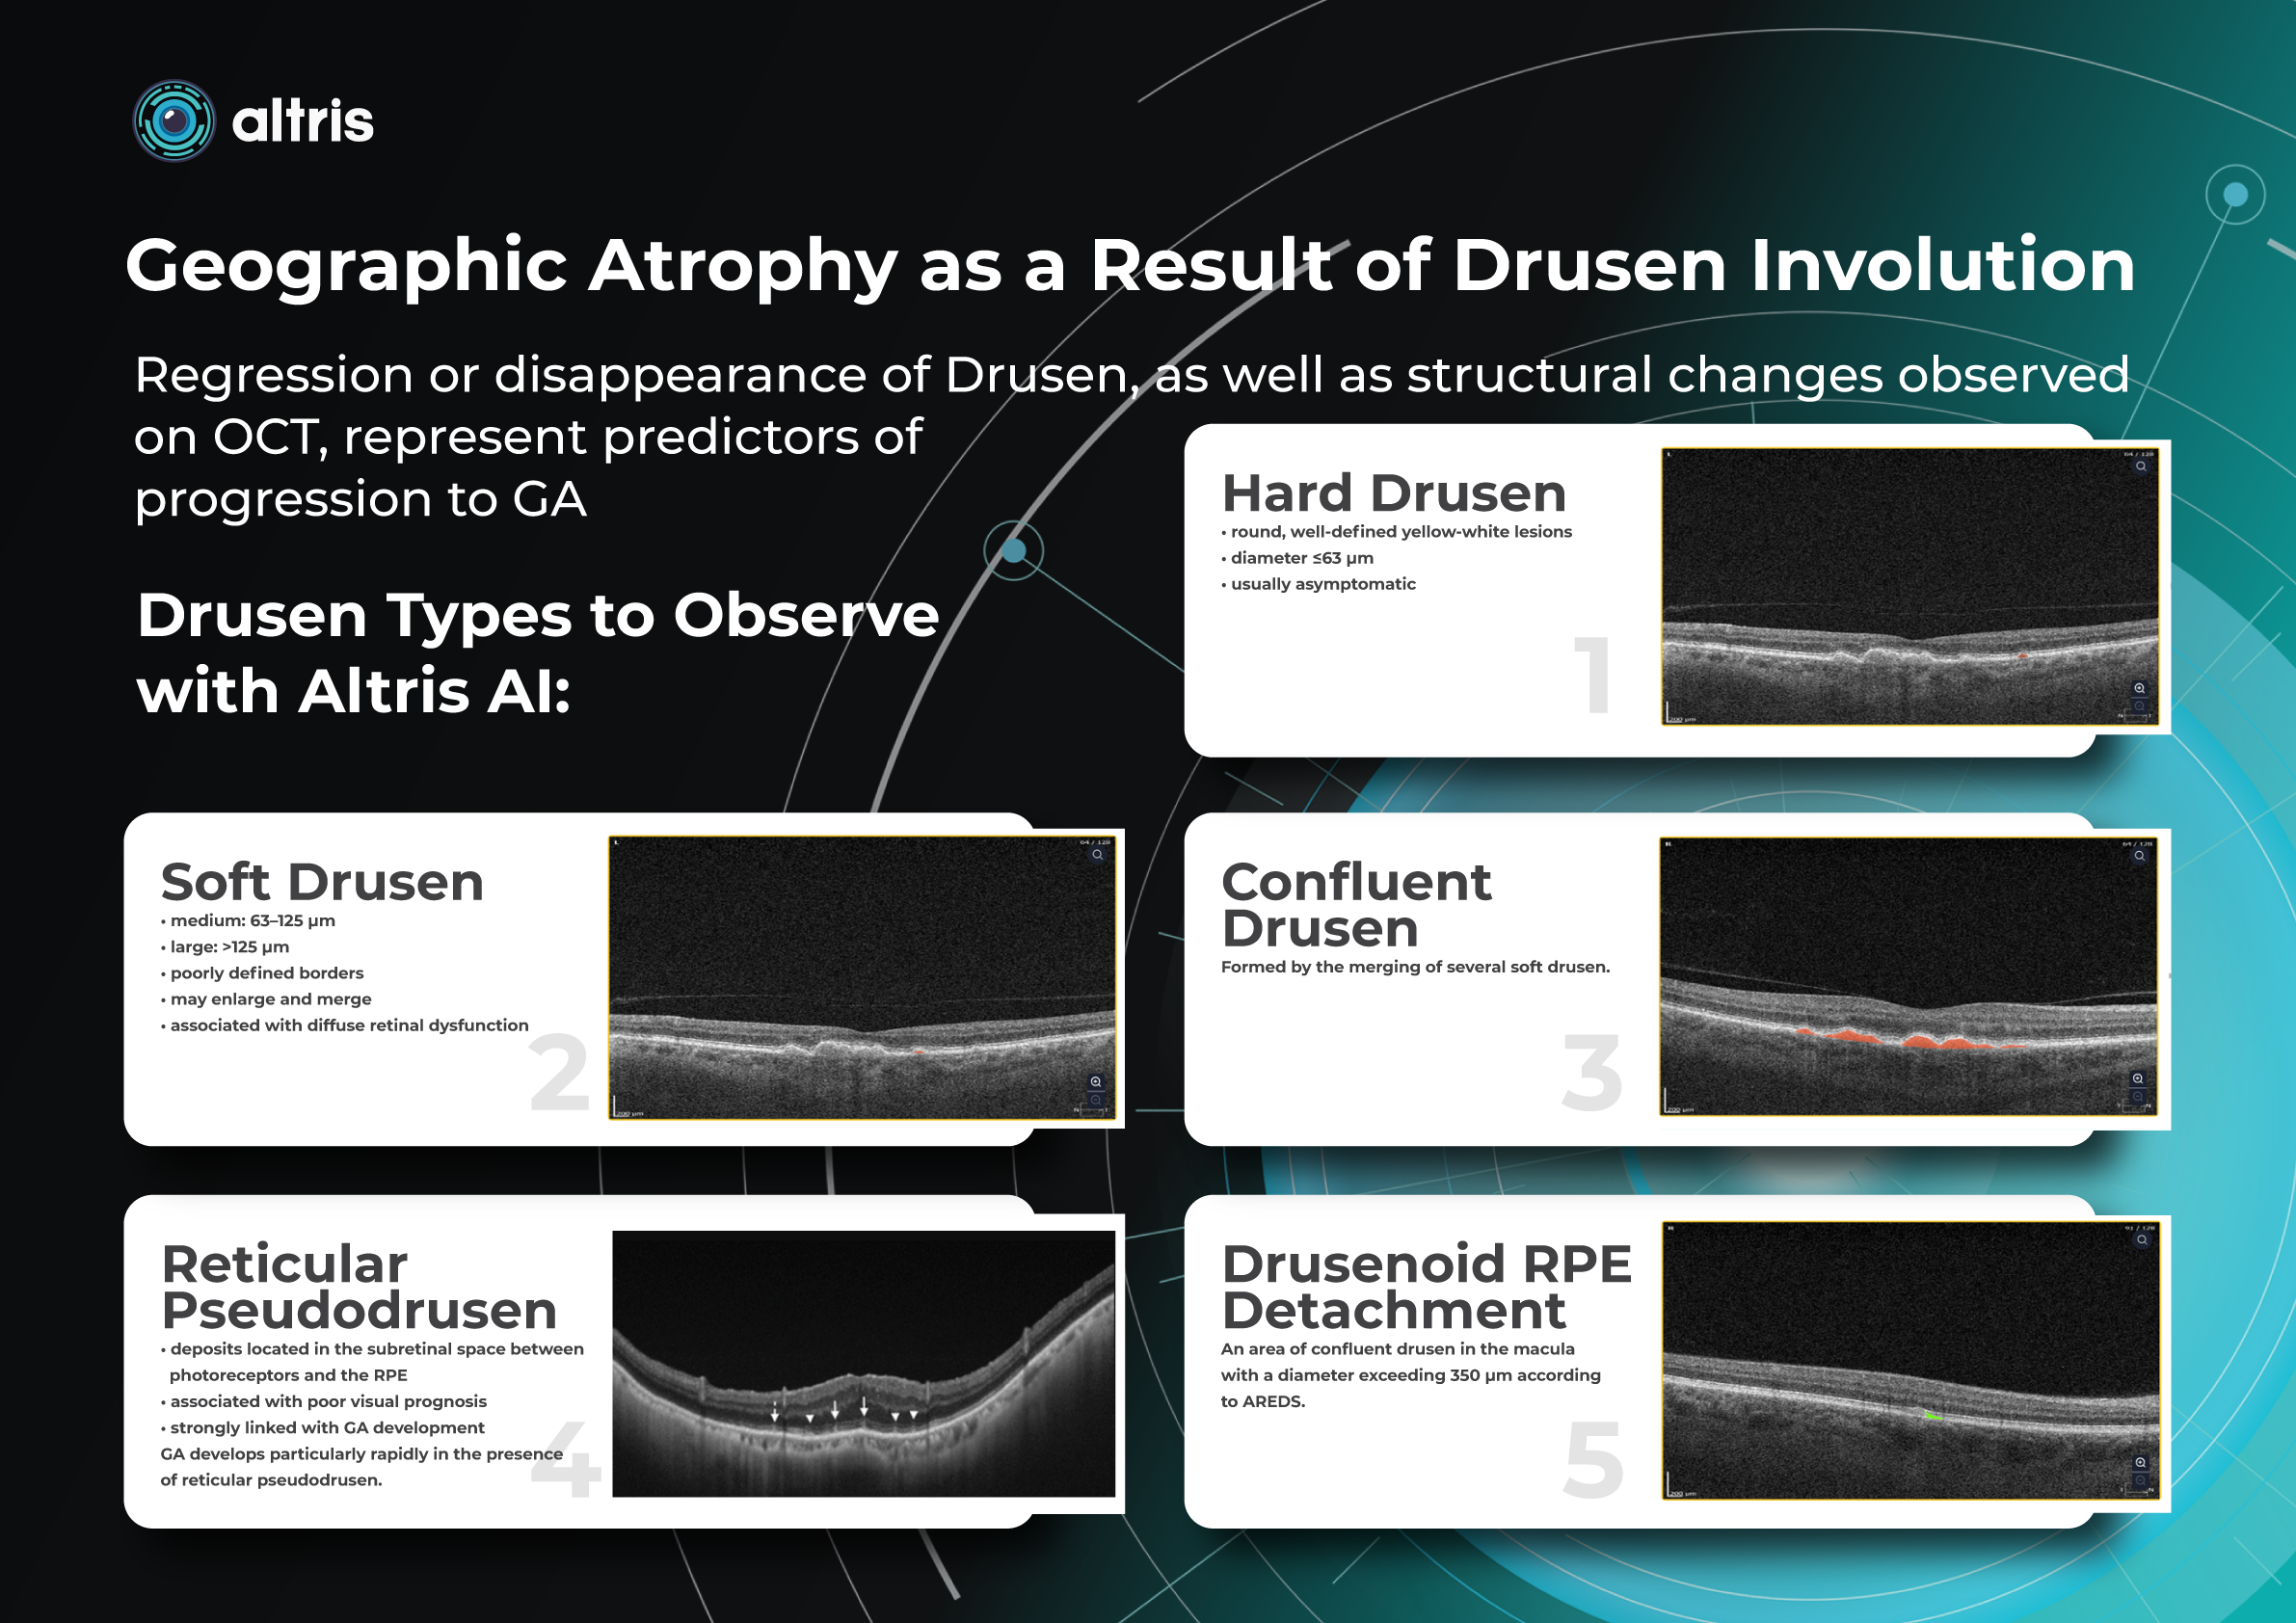
Geographic Atrophy as a Result of Drusen Involution
Drusen are localized accumulations of pathological material (photoreceptor metabolic by-products) between the RPE and Bruch’s membrane. They may change in number, size, and morphology.
Regression or disappearance of drusen, as well as structural changes observed on OCT, represent predictors of progression to GA. Regular monitoring allows early detection of potentially dangerous changes.
Types of Drusen
1. Hard Drusen
- round, well-defined yellow-white lesions
- diameter ≤63 µm
- usually asymptomatic
2. Soft Drusen
- medium: 63–125 µm
- large: >125 µm
- poorly defined borders
- may enlarge and merge
- associated with diffuse retinal dysfunction
3. Confluent Drusen
Formed by the merging of several soft drusen.
4. Drusenoid RPE Detachment
An area of confluent drusen in the macula with a diameter exceeding 350 µm according to AREDS.
5. Cuticular Drusen
- located between the RPE and Bruch’s membrane
- small in diameter but numerous
- often confluent
- steep, sloping sides (“saw-tooth” appearance)
- may disrupt RPE structure
- represent a risk factor for progression to GA
6. Reticular Pseudodrusen
- deposits located in the subretinal space between photoreceptors and the RPE
- associated with poor visual prognosis
- strongly linked with GA development
GA develops particularly rapidly in the presence of reticular pseudodrusen.
Predictors of GA Development in Eyes with Drusen
- large numbers of drusen, particularly in the central macula
- regression of drusen
- structural changes such as heterogeneous internal reflectivity
These predictors help identify patients at high risk for GA development and are valuable for optimizing monitoring intervals and potential preventive strategies.
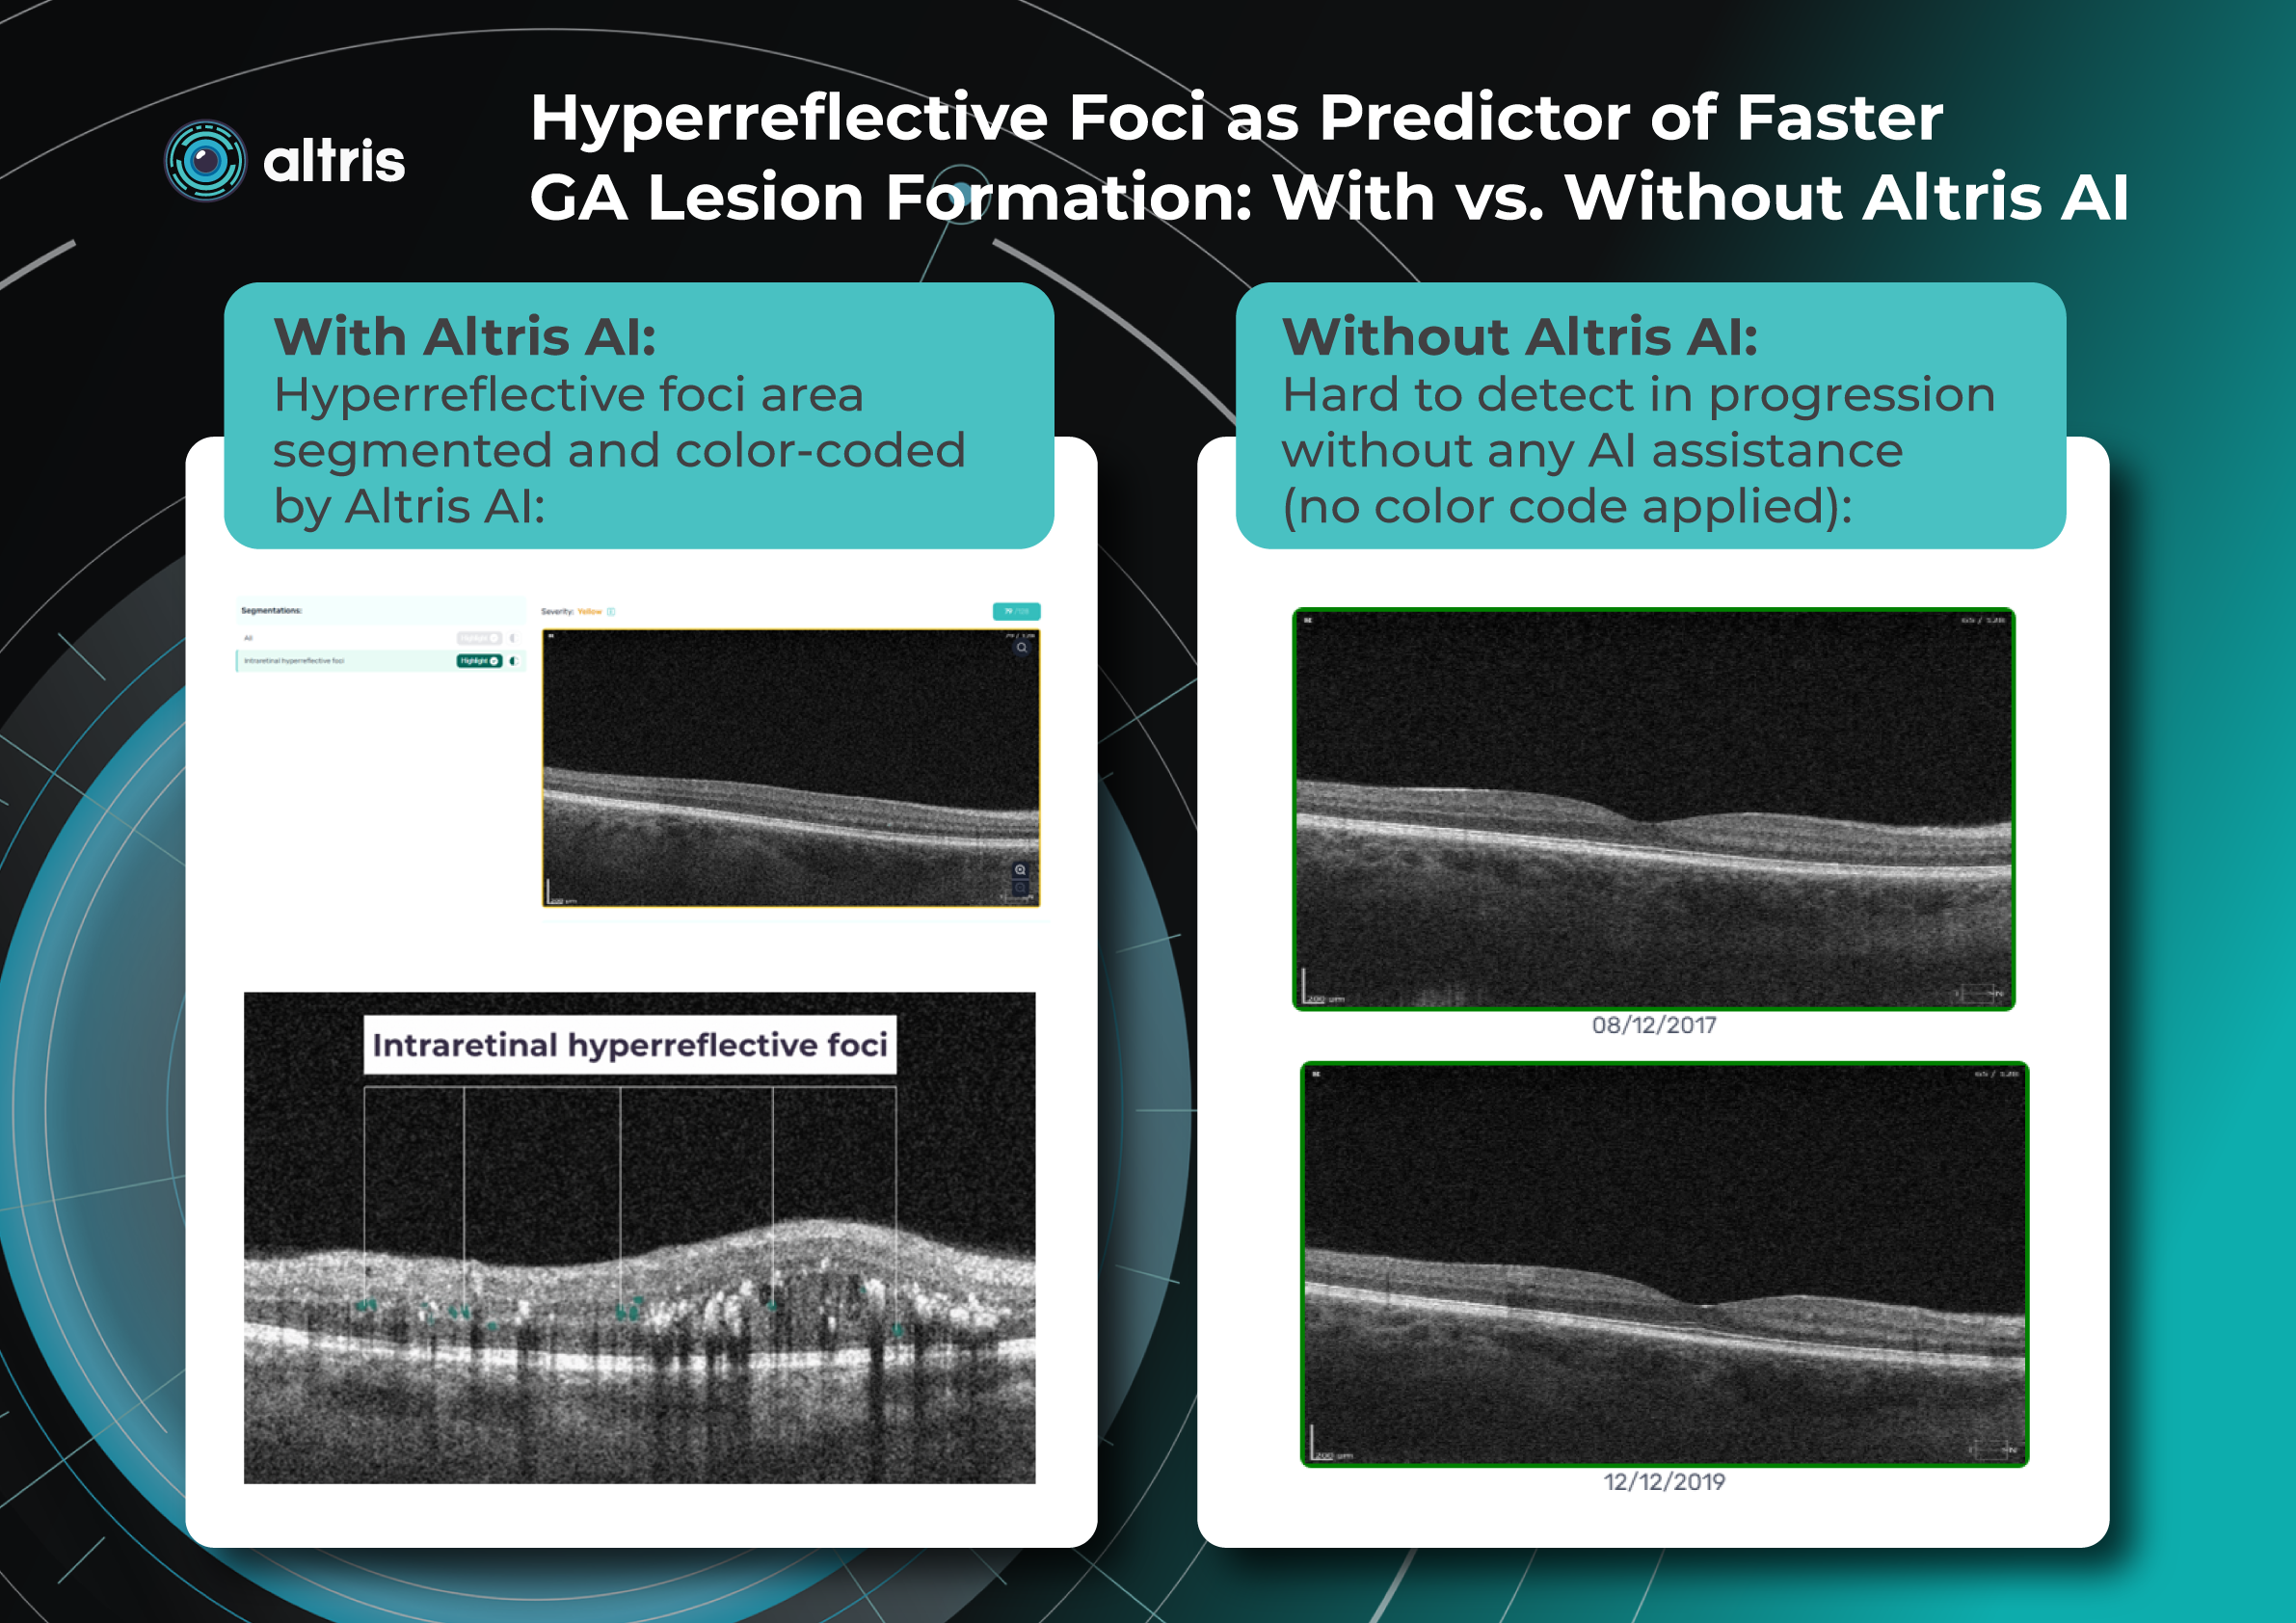
Another predictor of faster GA lesion formation is hyperreflective foci. These are small intraretinal hyperreflective dots, often located above drusen and typically associated with local disruption of the RPE structure. They likely represent migrating RPE cells and activated microglia. A tiny blue spot is a hyperreflective foci area detected by Altris automated GA segmentation OCT:
Their presence significantly increases the risk of GA development within the next few years (in some studies up to five-fold within two years).
Clinical Importance of Predictors
Identifying high-risk patients allows clinicians to:
- individualize OCT monitoring frequency
- initiate treatment earlier
- predict functional vision loss
- discuss expected disease progression with patients in a timely manner.
Management of Geographic Atrophy and Patient Education
Management of patients with GA today extends far beyond simple observation. It involves an active, structured strategy that combines regular OCT monitoring, timely initiation of therapy, risk-factor modification, and comprehensive patient education.
The main goal is to slow disease progression and reduce the rate of atrophy expansion while preserving the central fovea for as long as possible. GA Progression quantified via Altris:
The Role of OCT
Effective GA management is impossible without high-quality OCT monitoring.
OCT enables clinicians to:
- quantify the area of atrophy
- determine the rate of lesion expansion
- measure the distance to the fovea
- analyze outer retinal layer integrity
- identify predictors of rapid progression
Monitoring is recommended every 3–6 months, and when intravitreal therapy is used, OCT should be performed before each injection to assess disease activity and lesion growth rate.
OCT also serves as a powerful motivational tool: showing patients the dynamics of structural changes helps them better understand the need for treatment and regular follow-up visits.
Patients should be informed that GA may progress without sudden visual deterioration. Structural OCT changes often precede functional vision loss, making regular examinations essential even when visual acuity appears stable.
Current Treatment Options

Intravitreal Therapy
- Izervay (avacincaptad pegol)
- Syfovre (pegcetacoplan)
For the first time in decades, FDA-approved treatments are available that slow the expansion rate of GA lesions. Although they do not restore lost vision, slowing visual decline is an important clinical goal.
Patients should clearly understand that treatment slows progression but does not restore vision. Proper expectation management improves treatment adherence and reduces disappointment.
Nutritional Supplements
Formulations based on AREDS / AREDS2 have been shown to reduce the risk of progression from intermediate AMD to advanced stages.
Patients should be informed that these supplements do not treat GA, but may have preventive value at earlier stages.
What Patients Must Understand
1. Progressive Nature of GA
GA is a chronic progressive disease. The area of atrophy almost always increases over time. The rate of progression varies depending on morphological characteristics.
Patients should understand that treatment aims to slow, not completely stop, disease progression.
2. Importance of Lifestyle
Although lifestyle modification has limited influence once GA is established, recommendations remain relevant:
- smoking cessation
- blood pressure and lipid control
- antioxidant-rich diet and omega-3 fatty acids
- regular physical activity
These factors improve overall vascular health and may reduce systemic inflammation.
3. Psychological Adaptation
Progressive central vision loss often leads to anxiety, fear of blindness, and reduced social activity.
It is important to discuss:
- low-vision aids (magnifiers, telescopic glasses, electronic magnifiers)
- support resources for people with low vision
Psychological support significantly improves adaptation and quality of life.
Patient Partnership: The Foundation of Success
Modern management of dry AMD is no longer hopeless. With approved therapies and evidence-based preventive strategies, clinicians can meaningfully influence the rate of disease progression.
However, the effectiveness of any strategy depends on collaboration between the physician and the patient.
Patient education regarding:
- the nature of the disease
- the role of regular OCT monitoring
- treatment possibilities and limitations
- the importance of lifestyle modification
is an essential component of modern GA management.
FAQs
Which OCT biomarkers are predictive of GA progression to look for?
Key biomarkers include hypertransmission defects, RPE atrophy, photoreceptor loss, ellipsoid zone disruption, hyperreflective foci, and reticular pseudodrusen. These structural changes are strongly associated with GA development and progression in AMD.
How does AI OCT help prioritize patients at risk of GA progression?
AI for GA systems identifies high-risk biomarkers and calculates progression rates, enabling clinicians to triage patients for closer monitoring or treatment.
Can AI detect multiple retinal pathologies in addition to GA?
Many platforms detect 70+ retinal pathologies and biomarkers simultaneously on OCT scans. Altris detects and quantifies 40+ retina biomarkers and 40+ pathologies.
How can AI quantify geographic atrophy on OCT scans?
AI algorithms automatically segment GA lesions and calculate lesion area, retinal layer loss, and biomarker overlap, providing objective measurements in millimeters or percentages.
Can AI OCT support treatment decisions for GA therapies?
AI can measure structural parameters such as EZ loss or RPE integrity, which may help evaluate treatment response or disease activity. Altris applies Flags to filter out the eligible patients then.
Can AI detect early GA before it becomes clinically visible?
Yes. AI models can identify subtle structural abnormalities on OCT, such as EZ disruption or early hypertransmission, enabling earlier detection of atrophy.
Which OCT metrics should be monitored to track GA progression?
Clinically relevant metrics include: GA lesion area (mm²), rate of lesion growth, distance from lesion margin to the fovea, percentage of macular involvement. AI can automatically calculate and track these parameters over time.
How to efficiently measure geographic atrophy on OCT?
To efficiently measure Geographic Atrophy on Optical Coherence Tomography (OCT), clinicians should identify key biomarkers such as RPE loss, outer retinal thinning, and choroidal hypertransmission, then quantify the atrophy area (mm²) using en-face OCT or automated segmentation tools. Tracking lesion size and its distance to the fovea over time allows accurate monitoring of disease progression. AI-assisted OCT platforms can automate detection and measurements, making longitudinal assessment faster and more consistent.
References
- Guymer RH, Rosenfeld PJ, Curcio CA, et al.
Incomplete retinal pigment epithelium and outer retinal atrophy in age-related macular degeneration: Classification of Atrophy Meeting report.
Ophthalmology.
Available at: https://pubmed.ncbi.nlm.nih.gov/38387826/ - Natural history and progression of geographic atrophy in AMD.
ScienceDirect.
Available at: https://www.sciencedirect.com/science/article/pii/S2468653023006681 - OCT Spotlight: Characterizing Geographic Atrophy Development and Progression.
Retina Today.
Available at: https://retinatoday.com/articles/2025-apr/oct-spotlight-characterizing-ga-development-and-progression - Automated monitoring of geographic atrophy using OCT imaging.
Scientific Reports.
Available at: https://www.nature.com/articles/s41598-023-34139-2 - Classification of Atrophy Meeting (CAM) consensus for OCT-based atrophy classification in AMD.
American Academy of Ophthalmology Journal.
Available at: https://www.aaojournal.org/article/S0161-6420(17)31703-7/abstract - Identifying Geographic Atrophy Biomarkers.
Optometric Management.
Available at: https://www.optometricmanagement.com/issues/2025/october/identifying-geographic-atrophy-biomarkers/ - FDA Approval Announcement for Izervay (avacincaptad pegol).
Astellas Pharma Newsroom.
Available at:
https://newsroom.astellas.com/2023-08-05-Iveric-Bio-Receives-U-S-FDA-Approval-for-IZERVAY-TM-avacincaptad-pegol-intravitreal-solution-,-a-New-Treatment-for-Geographic-Atrophy
popular Posted
-
PBM Monitoring on OCT: Drusen Progression
Maria Znamenska
5 min.Introduction: Role of PBM in Retinal Disease Management
Photobiomodulation (PBM), also referred to as low-level light or laser therapy, has emerged as a promising non-invasive therapeutic strategy in ophthalmology, particularly for the management of retinal diseases. PBM utilizes low-energy light in the red-to-near-infrared spectrum (typically 600–1000 nm) to modulate cellular function through photochemical rather than thermal mechanisms.
At the cellular level, PBM primarily absorbs photons from mitochondrial chromophores, most notably cytochrome c oxidase, thereby enhancing mitochondrial respiration and increasing adenosine triphosphate (ATP) production. This process is accompanied by modulation of reactive oxygen species (ROS) and activation of intracellular signaling pathways, collectively promoting cellular survival, repair, and regeneration. Importantly, PBM has also been shown to reduce oxidative stress and inflammation—two central mechanisms implicated in the pathogenesis of many retinal disorders—by decreasing pro-inflammatory cytokines and enhancing antioxidant defenses.
The retina, characterized by high metabolic demand and susceptibility to oxidative damage, represents a particularly suitable target for PBM therapy. Experimental and clinical studies have demonstrated that PBM can improve photoreceptor survival, support retinal pigment epithelium (RPE) function, and enhance overall retinal homeostasis. In animal models, PBM has been associated with preservation of retinal structure and improved electrophysiological responses, while early clinical studies suggest potential benefits for visual acuity, contrast sensitivity, and reductions in pathological features such as drusen and retinal edema.
Clinically, PBM is being explored as an adjunctive or alternative treatment for several retinal diseases, including age-related macular degeneration (AMD), diabetic retinopathy (DR), and diabetic macular edema (DME). Its advantages include a favorable safety profile, non-invasive delivery, and relatively low cost compared to conventional therapies. Furthermore, advances in light-emitting diode (LED) technology have facilitated broader clinical application by enabling safe, uniform, and cost-effective retinal illumination.
Key OCT Biomarkers to Track During PBM Therapy
Optical coherence tomography (OCT) has become an indispensable tool for monitoring retinal structure and treatment response in patients undergoing photobiomodulation (PBM) therapy. Given the mechanism of PBM—targeting mitochondrial function, reducing oxidative stress, and modulating inflammation—several OCT-derived biomarkers are particularly relevant for assessing therapeutic efficacy of dry AMD progression and in other retinal disorders. Track and quantify the following biomarkers with Altris AI:
1.PBM monitoring on OCT: Drusen Progression
For patients on photobiomodulation (PBM), OCT monitoring of drusen is about one core question: Are we stabilizing or reversing RPE–Bruch’s membrane dysfunction, or is the eye still progressing toward atrophy? So, on B-scans, drusen are seen as:
- RPE elevations (dome-shaped or irregular)
- Material between RPE and Bruch’s membrane
- Variable internal reflectivity
Here are the key drusen biomarkers to track under PBM:
- Drusen volume (MOST important)
- Measured via OCT segmentation (cube scans)
- Represents total disease burden
As the PBM goal here is the stabilization or reduction in drusen volume
Red flag:
- Continuous increase → disease progression
- Drusen height & area
- Local structural impact on photoreceptors
PBM signal:
- Flattening = potential response
- Increasing height = worsening RPE dysfunction
- Internal reflectivity
- Homogeneous vs heterogeneous content
An important nuance is that increasing heterogeneity may indicate:
- calcification
- regression OR collapse before atrophy
So, it needs to be correlated with other signs.
You may observe Drusen regression patterns. However, not all regression is good.
“Good” regression:
- Gradual flattening
- No photoreceptor loss
- Stable RPE
“Bad” regression (collapse):
- Sudden disappearance
- Followed by:
- RPE loss
- outer retinal thinning
Leads to geographic atrophy (GA)
To summarise, for PBM-treated patients, prioritize:
- Drusen volume trend (longitudinal)
- Photoreceptor integrity (EZ/ONL)
- Signs of atrophy risk (HRF, collapse patterns)
Dry AMD progression matters in PBM monitoring. PBM is currently aimed at:
- early → intermediate dry AMD
So when you monitor drusen on OCT, you’re not just tracking morphology — you’re tracking disease trajectory: Is the eye staying in intermediate AMD, or moving toward advanced stages (GA / nAMD)?
2. Central retinal thickness (CRT)
In addition to PBM monitoring on OCT: drusen progression, one of the primary biomarkers is also central retinal thickness (CRT), which reflects changes in retinal edema and overall retinal integrity. Reductions in CRT during PBM therapy may indicate decreased inflammatory activity and improved fluid homeostasis, particularly in conditions such as diabetic macular edema (DME) and neovascular retinal diseases. However, in non-exudative conditions such as dry age-related macular degeneration (AMD), CRT changes may be subtle, necessitating the evaluation of additional structural parameters.
3. The outer retinal layers
The outer retinal layers, especially the integrity of the ellipsoid zone (EZ) and external limiting membrane (ELM), represent critical biomarkers of photoreceptor health. PBM has been associated with improved mitochondrial activity within photoreceptors, and preservation or restoration of EZ continuity on OCT may serve as a surrogate marker of functional recovery. Disruptions in these layers are strongly correlated with visual impairment, making them highly relevant endpoints in PBM studies.
4. Retinal pigment epithelium (RPE)
Another key biomarker is retinal pigment epithelium (RPE) morphology, including the presence and evolution of drusen, subretinal drusenoid deposits (SDD), and RPE irregularities. PBM has been hypothesized to enhance RPE function and reduce oxidative burden, potentially leading to stabilization or regression of drusen volume over time. Quantitative drusen analysis using OCT can therefore provide insight into disease modification, particularly in intermediate AMD.
5. Hyperreflective foci (HRF)
Hyperreflective foci (HRF) are also important indicators of retinal inflammation and microglial activation. A reduction in HRF number or density during PBM therapy may reflect decreased inflammatory signaling, aligning with the known anti-inflammatory effects of light-based treatment. Similarly, subretinal and intraretinal fluid—when present—should be carefully monitored, as their resolution may indicate improved retinal barrier function and treatment response.
6. Other
Emerging OCT biomarkers include choroidal thickness and choriocapillaris integrity, which are increasingly recognized as contributors to the pathophysiology of retinal disease. PBM may influence choroidal perfusion and metabolic exchange, and changes in choroidal thickness could serve as an indirect marker of vascular and metabolic improvements.
PBM Treatment Monitoring Protocol (Step-by-Step)
1. Patient Selection and Baseline Assessment
Appropriate patient selection is critical to optimizing outcomes of photobiomodulation (PBM) therapy in dry AMD progression. Current evidence supports its use primarily in non-exudative retinal diseases, particularly intermediate Age-related Macular Degeneration, as well as emerging applications in Diabetic Retinopathy and Diabetic Macular Edema.
Inclusion considerations:
- Intermediate AMD (presence of drusen and/or subretinal drusenoid deposits)
- Stable retinal conditions without active neovascularization
- Best-corrected visual acuity (BCVA) is sufficient for functional monitoring
Exclusion criteria:
- Active neovascular AMD or significant intraretinal/subretinal fluid
- Recent anti-VEGF injections (unless PBM is used adjunctively in controlled settings)
- Significant media opacity affecting light delivery or imaging quality
Baseline evaluation should include:
- Visual function testing: BCVA, contrast sensitivity
- Structural imaging: spectral-domain OCT (mandatory)
- Optional advanced imaging: OCT angiography (OCTA) for vascular assessment
- Key OCT biomarkers (baseline reference):
-
- Central retinal thickness (CRT)
- Ellipsoid zone (EZ) integrity
- Retinal pigment epithelium (RPE) status and drusen volume
- Presence of hyperreflective foci (HRF)
Establishing a robust baseline is essential, as PBM-induced changes are often gradual and require longitudinal comparison.
2. Treatment Session Procedure
PBM is delivered using low-level light in the red-to-near-infrared spectrum (typically ~600–1000 nm), most commonly via LED-based systems designed for retinal applications.
Standard session workflow:
- Patient preparation
- No pharmacologic dilation is typically required (device-dependent)
- Proper alignment and fixation ensured
- Device application
- Light delivered trans-pupillary using controlled, non-thermal energy
- Multi-wavelength protocols (e.g., combinations of ~590 nm, 660 nm, 850 nm) are commonly used in clinical studies
- Treatment duration
- Typically, a few minutes per eye per session (device-specific)
- Sequential or simultaneous bilateral treatment, depending on the system
- Safety monitoring
- PBM is non-invasive and well-tolerated
- No significant adverse retinal effects have been reported in the current literature
- Monitor for discomfort or visual disturbances (rare)
Immediate post-session:
- No recovery time required
- Patients resume normal activities immediately
The mechanism of action—enhancing mitochondrial activity and reducing oxidative stress—does not produce immediate anatomical changes, reinforcing the need for structured follow-up.
3. Treatment Series and Frequency
PBM is not a single-session therapy for observing dry AMD progression or any other condition, but is administered as a treatment series, followed by monitoring and potential retreatment cycles.
Typical treatment regimen (based on clinical studies):
- Induction phase:
- 2–3 sessions per week
- Duration: 3–5 weeks
- Total: ~9–12 sessions per cycle
- Follow-up period:
- Reassessment at 1–3 months post-treatment
- OCT imaging to evaluate structural response
- Retreatment strategy:
- Repeat cycles every 4–6 months, depending on disease progression and response
- Individualized based on OCT biomarkers and functional outcomes
Monitoring during and after therapy:
- Short-term (during treatment):
- Limited structural change expected
- Intermediate-term (1–3 months):
- Possible reduction in drusen volume
- Stabilization of EZ and RPE integrity
- Decrease in HRF (inflammatory markers)
- Long-term:
- Disease stabilization rather than reversal is the primary goal
Outcome measures:
- Functional: BCVA, contrast sensitivity
- Structural: OCT biomarkers (drusen, EZ, CRT, HRF)
- Optional: OCTA vascular parameters
A structured PBM protocol integrates careful patient selection, standardized treatment delivery, and longitudinal OCT-based monitoring. The therapy is best suited for chronic, non-exudative retinal conditions, where its cumulative biological effects—rather than immediate anatomical changes—drive clinical benefit. Consistent imaging and biomarker tracking are essential for guiding retreatment decisions and evaluating long-term efficacy.
Devices & AI for PBM Monitoring
LumiThera (Valeda)
Valeda is a photobiomodulation (PBM) device — currently the most clinically validated retinal light therapy. Company: LumiThera (now acquired by Alcon) Mechanism (PBM):
- Uses multiwavelength light:
- ~590 nm
- ~660 nm
- ~850 nm
- Targets mitochondria → increases ATP
- Reduces:
- oxidative stress
- inflammation
- Improves retinal cellular function
Clinical positioning
- Indicated for:
- early–intermediate dry AMD
- First device to:
- demonstrate visual improvement, not just slowing the disease
Regulatory & evidence strength:
- FDA-authorized (De Novo, 2024)
- CE marked, global use
- Backed by:
- LIGHTSITE trials (I–III)
- Demonstrated:
- ~1 line BCVA improvement over 24 months
Treatment protocol
- Standard cycle:
- 9 sessions over 3–5 weeks
- Repeat:
- every 4–6 months
- Fully clinic-based
Clinical effects
- Functional:
- ↑ visual acuity
- ↑ contrast sensitivity
- Structural (OCT):
- drusen stabilization/reduction
- preservation of retinal layers
- Strong safety profile
Thus, Valeda is currently:
The only FDA-authorized retinal PBM device
The only one with phase III randomized clinical trial data (LIGHTSITE)
And it has shown actual visual acuity improvement, not just safety.Espansione
This is an ophthalmology PBM platform (incl. retina use). Espansione develops photobiomodulation (PBM / LLLT) devices specifically for eye care. Espansione is a multi-technology ophthalmic platform, not just a PBM lamp.
It combines:
- LM™ LLLT (photobiomodulation / PBM) → core tech for retina
- OPE™ IPL → only for anterior segment
Their flagship eye-light® is used for:
- anterior segment (DED, MGD)
- posterior segment (including dry AMD progression)
- It has CE approval for retinal conditions like dry AMD
- The company explicitly states expansion into posterior segment care (retina)
This is another ophthalmic PBM device platform, with retina applications.
Light characteristics
- Wavelength range: ~500–1000 nm
- Typical retina protocol:
- Yellow (~590 nm)
- Red (~625 nm)
- Delivered via LED mask over closed eyes
Mechanism (important for retina positioning)
PBM targets mitochondria:
- ↑ ATP production
- ↓ oxidative stress (ROS)
- ↑ cellular repair
- ↓ inflammation
For retina specifically:
-
Improves RPE + photoreceptor metabolism
-
Supports choriocapillaris perfusion
-
Slows degeneration processes (AMD biology)
Retina applications
- Dry AMD progression (main indication)
- CE (MDR) cleared for dry AMD (dAMD)
- Focus: early–intermediate stages (AREDS 1–3)
Clinical effects shown:
- ↑ Visual acuity (BCVA gains)
- ↓ Drusen volume
- ↑ Choriocapillaris perfusion
Thus, it is disease-modifying intent, not just symptomatic.
Typical session:
- Duration: ~10–12 minutes
- Mask-based (non-contact)
- Eyes:
- mostly closed
- brief opening phases possible
Typical course:
- ~8 sessions / 3–4 weeks (in studies)
Very different from laser or injections:
- No dilation
- No contact lens
- No invasive steps
Here’s a comparison chart of the key characteristics and features of both devices:
LumiThera (Valeda) vs. Espansione (eye-light®)
Feature Espansione (eye-light®) LumiThera (Valeda) Platform Multi-use (anterior + retina) Retina-focused Delivery Mask (closed eye) Slit-lamp style Wavelengths Red + Yellow (+ Blue for anterior) Multi-wavelength LED Indication Dry AMD (CE) Dry AMD (FDA + CE) Position Broader clinic workflow Retina-specialist device Other Generic LED / Low-Level Light Therapy (LLLT) platforms
These are NOT branded retinal systems like Valeda or Espansione, but rather:
- LED arrays or laser-based PBM setups
- used in:
- early trials
- pilot studies
- lab settings
Typical characteristics:
- Wavelengths: 500–1000 nm
- Delivery:
- masks
- panels
- slit-lamp–mounted systems
Examples (non-standardized):
- custom LED rigs used in AMD studies
- early PBM prototypes before Valeda
- academic research devices
Problem:
- No standard protocol
- No regulatory approval
- Hard to compare outcomes
Experimental PBM Directions also include expanded PBM indications of
- diabetic retinopathy (DR)
- diabetic macular edema (DME)
- geographic atrophy
Next-gen PBM systems
Nevertheless, research in eye care is further exploring:
- different wavelength combinations
- dose optimization
- portable/home PBM (not validated yet)
Despite the fact that nothing close to Valeda-level evidence has emerged yet.
Modern PBM ecosystem classification
Tier 1 (validated):
- Valeda (LumiThera / now Alcon)
Tier 2 (investigational retinal PBM):
- academic LED systems
- prototype devices
Tier 3 (not true retinal PBM):
- dry eye LLLT
- cosmetic red light
- wellness devices
Clinical Application and Results
The integration of digital technologies and artificial intelligence (AI) into retinal imaging has significantly enhanced the ability to monitor treatment response in photobiomodulation (PBM) therapy. Given that PBM induces gradual, often subtle structural and functional changes, advanced analytical tools are essential for detecting and quantifying these effects with precision and reproducibility. Here are some real cases of application in Ophthalmology (Dry AMD, DME, etc).
Dry AMD
Photobiomodulation (PBM) has been clinically evaluated primarily in patients with early-to-intermediate Age-related Macular Degeneration, where no widely accepted disease-modifying therapy exists. The most robust evidence comes from the LIGHTSITE clinical trial program, in which PBM is delivered as multiwavelength light therapy (590, 660, and 850 nm) in repeated treatment cycles (typically 9 sessions over 3–5 weeks, repeated every 4 months).
Across the LIGHTSITE I–III studies, PBM has consistently demonstrated functional improvements, particularly in best-corrected visual acuity (BCVA) and contrast sensitivity, and has shown favorable safety outcomes, with no evidence of phototoxicity. In LIGHTSITE II, PBM-treated eyes showed a mean ~4-letter gain in BCVA at 9 months, with approximately one-third of patients achieving ≥5-letter improvement, while sham-treated eyes showed minimal change. Earlier studies also reported improvements in contrast sensitivity, microperimetry, and reductions in drusen burden, suggesting both functional and anatomical benefits .
More recent data from the pivotal LIGHTSITE III trial further support these findings, demonstrating statistically significant gains in visual acuity compared with sham treatment, with mean improvements exceeding 5 letters and a substantial proportion of patients achieving clinically meaningful gains. At 24 months, PBM-treated eyes showed sustained visual improvement (+6.2 letters) and a reduced progression to geographic atrophy (6.8% vs 24.0% in controls), suggesting potential disease-modifying effects.
However, despite these encouraging results, meta-analyses indicate that overall effect sizes remain modest and that variability across studies, small sample sizes, and protocol heterogeneity limit definitive conclusions regarding long-term clinical benefit. Thus, while PBM represents a promising and biologically plausible therapy for dry AMD, its role in routine clinical practice continues to evolve, with ongoing studies needed to confirm durability, optimal patient selection, and real-world effectiveness.
DME
Photobiomodulation (PBM) has been explored as a non-invasive adjunctive or alternative therapy for Diabetic Macular Edema, targeting key pathogenic mechanisms, including mitochondrial dysfunction, oxidative stress, and chronic inflammation.
Unlike anti-VEGF therapy, which primarily addresses vascular permeability, PBM aims to restore retinal metabolic balance through light-induced activation of mitochondrial pathways. Early clinical studies using red-to-near-infrared wavelengths (typically ~630–850 nm) have demonstrated reductions in central retinal thickness (CRT) and improvements in retinal morphology on OCT, alongside stabilization or modest gains in best-corrected visual acuity (BCVA). These effects are particularly notable in mild-to-moderate DME and in patients with non-center-involving edema, where PBM may reduce inflammatory signaling and improve fluid homeostasis.
Clinical data, although still limited compared to age-related macular degeneration, suggest that PBM may have value as an adjunct to standard of care, potentially reducing treatment burden in patients requiring repeated intravitreal injections. Some studies report decreased intraretinal fluid and improvement in OCT biomarkers following PBM treatment cycles, with a favorable safety profile and no evidence of retinal damage.
However, results remain heterogeneous, with variability in treatment protocols, patient populations, and outcome measures. Importantly, PBM has not yet demonstrated efficacy comparable to anti-VEGF therapy in center-involving DME, and its role is best considered complementary rather than substitutive at this stage. Larger randomized controlled trials are needed to define optimal dosing strategies, identify responder phenotypes, and clarify long-term functional benefits in DME management.
Why is OCT Critical for PBM Monitoring?
Optical Coherence Tomography (OCT) is essential for monitoring photobiomodulation (PBM) therapy because PBM aims to induce subtle, progressive structural and functional changes in the retina—especially in conditions like dry AMD progression.
Unlike anti-VEGF treatments, where effects can be more immediate, PBM outcomes are gradual and microstructural, such as changes in drusen volume, RPE integrity, outer retinal layers, and choriocapillaris perfusion. These changes are often invisible on fundus photography or visual acuity alone, making OCT the only practical tool for objective, layer-by-layer tracking over time.
Serial OCT scans allow clinicians to detect early signals of response (e.g., drusen regression or stabilization) and differentiate them from natural disease progression, which is critical for validating PBM efficacy in real-world practice.
AI-Assisted OCT Analysis
Artificial intelligence–driven analysis of optical coherence tomography (OCT) enables automated, quantitative assessment of retinal biomarkers critical to PBM monitoring. Machine learning and deep learning algorithms can segment retinal layers and identify pathological features such as drusen, hyperreflective foci (HRF), and fluid compartments with high accuracy.
In the context of PBM, AI tools provide:
- Automated retinal layer segmentation, including ellipsoid zone (EZ) and retinal pigment epithelium (RPE)
- Quantification of drusen volume and distribution, particularly relevant in Age-related Macular Degeneration
- Detection and tracking of subtle structural changes over time that may not be apparent on qualitative review
These capabilities are especially important because PBM effects are often incremental rather than dramatic, requiring sensitive longitudinal comparison.
Longitudinal Tracking and Progression Analysis
Digital platforms enable time-series analysis of OCT data, allowing clinicians to monitor the disease trajectory before, during, and after PBM therapy. Automated registration of sequential scans ensures that the same retinal locations are compared over time.
Key advantages include:
- Change detection algorithms for early identification of treatment response
- Trend analysis of biomarkers such as central retinal thickness, EZ integrity, and HRF density
- Objective progression metrics, reducing inter-observer variability
Such tools are critical for distinguishing true therapeutic effects from natural fluctuations in disease, particularly in slowly progressing conditions like dry AMD progression.
Digital tools and AI are transforming PBM monitoring by enabling precise, quantitative, and longitudinal assessment of retinal biomarkers. From automated OCT analysis to AI-driven decision support and remote monitoring, these technologies address the key challenge of PBM therapy—detecting subtle, progressive changes over time, like in dry AMD progression, etc. Their continued development will be essential for standardizing PBM protocols and optimizing patient outcomes in retinal disease management.
Altris AI for PBM monitoring on OCT: Drusen Progression +40 biomarkers
Altris AI has contributed to PBM monitoring on OCT: Drusen progression, as well as 40+ other biomarkers and 30+ pathologies, which may be monitored with the system. Altris AI enhances this process by turning OCT into a quantitative, standardized monitoring system rather than a subjective review. It automatically segments retinal layers and biomarkers (e.g., drusen, hyperreflective foci, fluid), calculates precise volumetric metrics, and enables longitudinal comparison across visits with high reproducibility. Here are the examples of biomarker monitoring cases via Altris AI:
- Drusen
Detection: ✔️
Quantification: ✔️ (area, volume, thickness)
Tracking over time: ✔️
This is one of the strongest use cases, which is critical for effective PBM monitoring.
- Central Retinal Thickness (CRT)
Detection: ✔️
Standard ETDRS maps: ✔️
Longitudinal tracking: ✔️
- Outer retinal layers (EZ, ONL, etc.)
Segmentation: ✔️ (layer-based)
Quantification: ✔️ (thickness, integrity)
Disruption detection: ✔️
This is very important for PBM response and detection of early functional damage.
- RPE (Retinal Pigment Epithelium)
Detection (layer): ✔️
Elevation (drusen): ✔️
Atrophy signs: ✔️ (via hypertransmission, thinning)
Important for: drusen interpretation and GA risk, though, not always a standalone numeric biomarker.
- Hyperreflective foci (HRF)
Detection: ✔️
Localization: ✔️
Counting / burden tracking: ✔️
These are high-value biomarkers for progression risk in PBM monitoring.
Assistance like this allows clinicians to track PBM response objectively, identify responders vs non-responders earlier, and generate consistent reports for clinical decision-making or research. In short, while OCT provides the necessary imaging depth, Altris AI unlocks its full value for PBM by making subtle retinal changes measurable, comparable, and clinically actionable.
Conclusion
PBM represents a novel and biologically plausible therapeutic modality that targets key pathological mechanisms in retinal disease. By enhancing mitochondrial function, reducing oxidative stress, and modulating inflammation, PBM holds significant potential to complement existing treatment strategies and improve outcomes in retinal disease management. However, further research is required to fully define its role in routine clinical practice.
Despite the promising findings, the clinical integration of PBM remains in an evolving stage. Variability in treatment parameters—including wavelength, dose, and treatment protocols—has limited standardization and comparability across studies. Moreover, much of the current evidence is derived from small-scale clinical trials and preclinical models, underscoring the need for large, randomized controlled trials to establish optimal treatment regimens for dry AMD progression and to assess long-term efficacy in other eye pathologies.
In this context, OCT—especially when enhanced with AI-driven analysis—plays a critical role in advancing PBM adoption. Quantitative OCT biomarkers such as drusen volume, outer retinal integrity, and subtle structural changes provide objective endpoints for assessing therapeutic response. AI-based platforms further enable precise, reproducible, and longitudinal analysis of these changes, helping to standardize evaluation, identify responders earlier, and strengthen the clinical evidence base for PBM.
FAQ Section
1. How do I objectively measure response to PBM therapy?
Clinicians look for quantifiable OCT biomarkers, not just visual acuity:
- Drusen volume (regression or stabilization)
- Outer retinal layer integrity (EZ, RPE)
- Hypertransmission / atrophy areas
The challenge: changes are subtle → require precise, longitudinal OCT comparison.
2. Which OCT biomarkers are most relevant for PBM monitoring?
The most discussed and clinically relevant:
- Drusen volume/area
- RPE atrophy
- Hypertransmission
- Ellipsoid Zone (EZ) disruption/loss
- Hyperreflective foci (secondary)
For GA specifically:
Overlap of RPE atrophy + hypertransmission + EZ loss = key composite metric.
3. How often should I monitor patients on PBM?
Typical real-world patterns:
- Baseline OCT before starting PBM
- Follow up every 3–6 months
- More frequent (monthly) in studies.
4. How do I distinguish PBM effect from natural AMD progression?
Distinguishing the effect of PBM from the natural progression of AMD remains one of the key clinical challenges. AMD typically progresses slowly and can show natural fluctuations, while PBM-related changes tend to be gradual and relatively modest. To differentiate between the two, clinicians rely on consistent OCT metrics tracked over time, comparing trends rather than single visits. Bilateral analysis—evaluating treated versus untreated eyes—can provide additional context, while assessing the rate of change, such as slowing of drusen growth or stabilization of atrophic areas, helps determine whether observed changes are likely treatment-related rather than part of the disease’s natural course.
5.Do I need AI/software for PBM monitoring, or is manual OCT review enough?
Whether AI/software is needed for PBM monitoring versus manual OCT review is an increasingly important question in clinical practice. While manual assessment can provide a general, qualitative understanding, it is often variable, time-consuming, and limited in its ability to detect subtle changes. PBM, however, requires identification of micron-level structural differences and high reproducibility across visits to accurately assess treatment response. AI-based OCT analysis addresses these challenges by enabling automated segmentation of key biomarkers, delivering precise volumetric measurements, and supporting reliable longitudinal tracking in standardized units such as mm², mm³, and percentage change. This level of consistency also helps clinicians more confidently distinguish responders from non-responders, making monitoring more objective and clinically actionable.
References:
https://pmc.ncbi.nlm.nih.gov/articles/PMC11488463/
https://link.springer.com/article/10.1007/s40135-025-00340-x
https://d-nb.info/136218389X/34
https://www.frontiersin.org/journals/ophthalmology/articles/10.3389/fopht.2024.1388602/full
https://retinatoday.com/articles/2020-may-june/photobiomodulation-as-a-treatment-in-dry-amd
https://espansionegroup.it/it/
-
Geographic Atrophy Retina OCT Biomarkers: Detection, Quantification, and Monitoring
Maria Znamenska
5 min.Introduction. Overview of Geographic Atrophy (GA) as a Late Stage of Dry AMD
Geographic atrophy (GA) is a chronic progressive retinal degeneration that represents part of the late stage of age-related macular degeneration (AMD). It is characterized by gradual and irreversible atrophy of photoreceptors, the retinal pigment epithelium (RPE), and the choriocapillaris. As a result, a persistent defect of neurosensory tissue develops, which clinically manifests as central vision loss, the appearance of central scotomas, and reduced contrast sensitivity.
Atrophic lesions typically originate in the outer retinal layers and gradually expand, involving the macula and fovea. Over time, this leads to irreversible visual impairment and a significant decline in quality of life. In the early stages, patients may not experience noticeable changes in visual acuity. However, involvement of the central foveal region may lead to a sudden functional deterioration, with patients reporting difficulties in reading, recognizing faces, and working with fine details.
GA is considered one of the leading causes of clinically significant central blindness among people over the age of 60 in developed countries. With the aging population, the prevalence of this condition continues to increase, creating a substantial social and economic burden. In addition to reduced visual acuity, GA significantly affects patients’ quality of life.
Geographic atrophy retina OCT, together with modern digital image analysis algorithms, has become a key tool in the diagnosis, monitoring, and evaluation of OCT biomarkers predicting GA progression. OCT provides cross-sectional imaging of the retina with microscopic resolution, enabling detailed assessment of individual retinal structures—from the inner retinal layers to the RPE–Bruch’s membrane–choriocapillaris complex. This technology has enabled the transition from subjective ophthalmoscopic assessment to objective structural analysis.
The advantages of OCT in the diagnosis and monitoring of GA include its non-invasive nature, high reproducibility, ability to detect early structural changes, and accurate quantitative measurements. Structural alterations at the level of photoreceptors and the RPE often occur long before they become visible on ophthalmoscopy or fundus photography. Proper recognition of OCT biomarkers of GA is essential not only for disease diagnosis but also for personalizing treatment strategies, predicting the risk of progression, and evaluating therapeutic outcomes.
The purpose of this article is to summarize current scientific evidence on OCT biomarkers of geographic atrophy, including their morphological definition, quantitative parameters, prognostic significance, and role in monitoring disease progression. Particular attention will be given to the practical aspects of OCT in clinical practice, interpretation of longitudinal changes, and effective communication with patients regarding the expected course of the disease.
2. Main OCT Biomarkers of Geographic Atrophy
Modern understanding of GA morphology has been largely shaped by the work of international expert groups, particularly the Classification of Atrophy Meetings (CAM) Group. The CAM group proposed standardized terminology and clear OCT-based criteria for retinal atrophy, enabling harmonization of diagnostic approaches in both clinical practice and multicenter studies.
The CAM group recommends spectral-domain OCT (SD-OCT) as the preferred imaging modality for detecting GA-related changes, as it allows identification of the earliest signs of developing atrophy.
2.1 OCT Signs of Geographic Atrophy
The following three features form the basis for the standardized OCT definition of GA:
- Loss of the outer retina
- Loss of the retinal pigment epithelium (RPE) ≥250 µm in diameter
- Choroidal hypertransmission ≥250 µm in diameter
1. Loss of the Outer Retinal Layers
On OCT B-scans this manifests as:
- disruption or loss of the ellipsoid zone (EZ)
- absence of the interdigitation zone
- thinning or complete loss of the outer nuclear layer (ONL)
- thinning (atrophic changes) of the neuroepithelium above the lesion
This feature reflects the loss of photoreceptors, which are the primary functional elements responsible for central vision.
2. Loss of the Retinal Pigment Epithelium (RPE)
The CAM group established a threshold of 250 µm in the largest horizontal dimension to define clinically significant atrophy.
AI detection of RPE atrophy OCT appears as:
- absence or severe thinning of the hyperreflective RPE band
- a well-defined border between preserved and atrophic RPE
3. Choroidal Hypertransmission
Due to the loss of the RPE, light penetrates more deeply into the underlying layers, resulting in increased visualization of the choroid.
On OCT this appears as:
- Increased visibility of the choriocapillaris layer
- Clear correspondence with the area of RPE defect
Classification of Outer Retinal Atrophy Associated with AMD
- Complete RPE and outer retinal atrophy (cRORA)
- Incomplete RPE and outer retinal atrophy (iRORA)
- Complete outer retinal atrophy (cORA)
- Incomplete outer retinal atrophy (iORA)
2.2 OCT Parameters for Monitoring Geographic Atrophy
Once the diagnosis is established, OCT biomarkers predicting GA progression and quantitative monitoring of disease progression becomes critical.
1. Morphological Triad
RPE atrophy, choroidal hypertransmission, and neuroepithelial atrophy represent the hallmarks of complete retinal atrophy.
This triad defines retinal atrophy within the lesion area and allows differentiation between complete and incomplete atrophy using structural criteria.
2. Area of Geographic Atrophy (mm²)
Quantitative measurement of GA area is a key parameter in both clinical practice and research.
OCT segmentation enables highly reproducible calculation of the affected area. Modern OCT systems allow:
- automatic segmentation of atrophy boundaries
- calculation of the GA area in mm²
- comparison of measurements between visits
The annual enlargement rate of the GA area is an objective marker of disease progression and correlates with functional visual outcomes. Importantly, the GA area may increase even when visual acuity remains stable.
The area of GA served as the primary endpoint in clinical trials evaluating the intravitreal therapies Syfovre and Izervay, which were recently approved by the FDA as treatments to slow GA lesion growth.
AI-based algorithms further improve the precision and reproducibility of measurements, which is particularly important for long-term monitoring.
Modern OCT systems provide GA area measurements in mm², and comparisons between visits provide an objective measure of disease dynamics. Even when patients do not perceive changes, increasing lesion area confirms disease progression.
3. Distance Between GA Lesions and the Fovea
An important quantitative parameter is the distance between the foveal center and the nearest border of the atrophic lesion.
This parameter has direct functional significance. Decreasing distance over time correlates with declining visual function: the closer GA approaches the fovea, the higher the risk of sudden vision loss.
Patients with GA lesions approaching the fovea have a poorer prognosis and often require more intensive monitoring and therapeutic interventions.
This parameter also allows objective risk prediction and supports:
- early referral to specialized ophthalmology centers
- discussion of potential vision loss with patients
2.3 Predictors of GA Development and Progression
GA frequently develops as a consequence of drusen involution or structural alterations of the RPE.
GA lesions in AMD may arise in association with:
- certain drusen types (large or confluent drusen, reticular pseudodrusen)
- previous choroidal neovascularization
- RPE detachment or RPE tear
- refractile deposits
- vitelliform lesions
Geographic Atrophy as a Result of Drusen Involution
Drusen are localized accumulations of pathological material (photoreceptor metabolic by-products) between the RPE and Bruch’s membrane. They may change in number, size, and morphology.
Regression or disappearance of drusen, as well as structural changes observed on OCT, represent predictors of progression to GA. Regular monitoring allows early detection of potentially dangerous changes.
Types of Drusen
1. Hard Drusen
- round, well-defined yellow-white lesions
- diameter ≤63 µm
- usually asymptomatic
2. Soft Drusen
- medium: 63–125 µm
- large: >125 µm
- poorly defined borders
- may enlarge and merge
- associated with diffuse retinal dysfunction
3. Confluent Drusen
Formed by the merging of several soft drusen.
4. Drusenoid RPE Detachment
An area of confluent drusen in the macula with a diameter exceeding 350 µm according to AREDS.
5. Cuticular Drusen
- located between the RPE and Bruch’s membrane
- small in diameter but numerous
- often confluent
- steep, sloping sides (“saw-tooth” appearance)
- may disrupt RPE structure
- represent a risk factor for progression to GA
6. Reticular Pseudodrusen
- deposits located in the subretinal space between photoreceptors and the RPE
- associated with poor visual prognosis
- strongly linked with GA development
GA develops particularly rapidly in the presence of reticular pseudodrusen.
Predictors of GA Development in Eyes with Drusen
- large numbers of drusen, particularly in the central macula
- regression of drusen
- structural changes such as heterogeneous internal reflectivity
These predictors help identify patients at high risk for GA development and are valuable for optimizing monitoring intervals and potential preventive strategies.
Another predictor of faster GA lesion formation is hyperreflective foci. These are small intraretinal hyperreflective dots, often located above drusen and typically associated with local disruption of the RPE structure. They likely represent migrating RPE cells and activated microglia. A tiny blue spot is a hyperreflective foci area detected by Altris automated GA segmentation OCT:
Their presence significantly increases the risk of GA development within the next few years (in some studies up to five-fold within two years).
Clinical Importance of Predictors
Identifying high-risk patients allows clinicians to:
- individualize OCT monitoring frequency
- initiate treatment earlier
- predict functional vision loss
- discuss expected disease progression with patients in a timely manner.
Management of Geographic Atrophy and Patient Education
Management of patients with GA today extends far beyond simple observation. It involves an active, structured strategy that combines regular OCT monitoring, timely initiation of therapy, risk-factor modification, and comprehensive patient education.
The main goal is to slow disease progression and reduce the rate of atrophy expansion while preserving the central fovea for as long as possible. GA Progression quantified via Altris:
The Role of OCT
Effective GA management is impossible without high-quality OCT monitoring.
OCT enables clinicians to:
- quantify the area of atrophy
- determine the rate of lesion expansion
- measure the distance to the fovea
- analyze outer retinal layer integrity
- identify predictors of rapid progression
Monitoring is recommended every 3–6 months, and when intravitreal therapy is used, OCT should be performed before each injection to assess disease activity and lesion growth rate.
OCT also serves as a powerful motivational tool: showing patients the dynamics of structural changes helps them better understand the need for treatment and regular follow-up visits.
Patients should be informed that GA may progress without sudden visual deterioration. Structural OCT changes often precede functional vision loss, making regular examinations essential even when visual acuity appears stable.
Current Treatment Options
Intravitreal Therapy
- Izervay (avacincaptad pegol)
- Syfovre (pegcetacoplan)
For the first time in decades, FDA-approved treatments are available that slow the expansion rate of GA lesions. Although they do not restore lost vision, slowing visual decline is an important clinical goal.
Patients should clearly understand that treatment slows progression but does not restore vision. Proper expectation management improves treatment adherence and reduces disappointment.
Nutritional Supplements
Formulations based on AREDS / AREDS2 have been shown to reduce the risk of progression from intermediate AMD to advanced stages.
Patients should be informed that these supplements do not treat GA, but may have preventive value at earlier stages.
What Patients Must Understand
1. Progressive Nature of GA
GA is a chronic progressive disease. The area of atrophy almost always increases over time. The rate of progression varies depending on morphological characteristics.
Patients should understand that treatment aims to slow, not completely stop, disease progression.
2. Importance of Lifestyle
Although lifestyle modification has limited influence once GA is established, recommendations remain relevant:
- smoking cessation
- blood pressure and lipid control
- antioxidant-rich diet and omega-3 fatty acids
- regular physical activity
These factors improve overall vascular health and may reduce systemic inflammation.
3. Psychological Adaptation
Progressive central vision loss often leads to anxiety, fear of blindness, and reduced social activity.
It is important to discuss:
- low-vision aids (magnifiers, telescopic glasses, electronic magnifiers)
- support resources for people with low vision
Psychological support significantly improves adaptation and quality of life.
Patient Partnership: The Foundation of Success
Modern management of dry AMD is no longer hopeless. With approved therapies and evidence-based preventive strategies, clinicians can meaningfully influence the rate of disease progression.
However, the effectiveness of any strategy depends on collaboration between the physician and the patient.
Patient education regarding:
- the nature of the disease
- the role of regular OCT monitoring
- treatment possibilities and limitations
- the importance of lifestyle modification
is an essential component of modern GA management.
FAQs
Which OCT biomarkers are predictive of GA progression to look for?
Key biomarkers include hypertransmission defects, RPE atrophy, photoreceptor loss, ellipsoid zone disruption, hyperreflective foci, and reticular pseudodrusen. These structural changes are strongly associated with GA development and progression in AMD.
How does AI OCT help prioritize patients at risk of GA progression?
AI for GA systems identifies high-risk biomarkers and calculates progression rates, enabling clinicians to triage patients for closer monitoring or treatment.
Can AI detect multiple retinal pathologies in addition to GA?
Many platforms detect 70+ retinal pathologies and biomarkers simultaneously on OCT scans. Altris detects and quantifies 40+ retina biomarkers and 40+ pathologies.
How can AI quantify geographic atrophy on OCT scans?
AI algorithms automatically segment GA lesions and calculate lesion area, retinal layer loss, and biomarker overlap, providing objective measurements in millimeters or percentages.
Can AI OCT support treatment decisions for GA therapies?
AI can measure structural parameters such as EZ loss or RPE integrity, which may help evaluate treatment response or disease activity. Altris applies Flags to filter out the eligible patients then.
Can AI detect early GA before it becomes clinically visible?
Yes. AI models can identify subtle structural abnormalities on OCT, such as EZ disruption or early hypertransmission, enabling earlier detection of atrophy.
Which OCT metrics should be monitored to track GA progression?
Clinically relevant metrics include: GA lesion area (mm²), rate of lesion growth, distance from lesion margin to the fovea, percentage of macular involvement. AI can automatically calculate and track these parameters over time.
How to efficiently measure geographic atrophy on OCT?
To efficiently measure Geographic Atrophy on Optical Coherence Tomography (OCT), clinicians should identify key biomarkers such as RPE loss, outer retinal thinning, and choroidal hypertransmission, then quantify the atrophy area (mm²) using en-face OCT or automated segmentation tools. Tracking lesion size and its distance to the fovea over time allows accurate monitoring of disease progression. AI-assisted OCT platforms can automate detection and measurements, making longitudinal assessment faster and more consistent.
References
- Guymer RH, Rosenfeld PJ, Curcio CA, et al.
Incomplete retinal pigment epithelium and outer retinal atrophy in age-related macular degeneration: Classification of Atrophy Meeting report.
Ophthalmology.
Available at: https://pubmed.ncbi.nlm.nih.gov/38387826/ - Natural history and progression of geographic atrophy in AMD.
ScienceDirect.
Available at: https://www.sciencedirect.com/science/article/pii/S2468653023006681 - OCT Spotlight: Characterizing Geographic Atrophy Development and Progression.
Retina Today.
Available at: https://retinatoday.com/articles/2025-apr/oct-spotlight-characterizing-ga-development-and-progression - Automated monitoring of geographic atrophy using OCT imaging.
Scientific Reports.
Available at: https://www.nature.com/articles/s41598-023-34139-2 - Classification of Atrophy Meeting (CAM) consensus for OCT-based atrophy classification in AMD.
American Academy of Ophthalmology Journal.
Available at: https://www.aaojournal.org/article/S0161-6420(17)31703-7/abstract - Identifying Geographic Atrophy Biomarkers.
Optometric Management.
Available at: https://www.optometricmanagement.com/issues/2025/october/identifying-geographic-atrophy-biomarkers/ - FDA Approval Announcement for Izervay (avacincaptad pegol).
Astellas Pharma Newsroom.
Available at:
https://newsroom.astellas.com/2023-08-05-Iveric-Bio-Receives-U-S-FDA-Approval-for-IZERVAY-TM-avacincaptad-pegol-intravitreal-solution-,-a-New-Treatment-for-Geographic-Atrophy
-
Altris AI Receives Health Canada Approval

 Altris Inc.
Altris AI Receives Health Canada Approval, Reinforcing Its Position as a Globally Trusted AI Decision Support Platform for OCT Analysis
Regulatory clearance marks a pivotal milestone in Altris AI’s international expansion and its mission to bring clinical-grade AI to eye care worldwide.
10 March 2026 — Altris AI, a leading provider of AI-powered decision support for optical coherence tomography (OCT) analysis, today announced it has received approval from Health Canada | Santé Canada, Canada’s federal health regulatory authority. This clearance represents a significant step forward in the company’s global growth strategy and its commitment to meeting the highest standards of medical device safety and clinical reliability.
For a company scaling across international markets, regulatory approvals are far more than administrative milestones — they are foundational growth enablers. Health Canada approval strengthens Altris AI’s international positioning, opens new pathways for future regulatory submissions across key markets, and delivers a clear signal to the global healthcare community: Altris AI is built for real-world clinical practice.
The approval confirms that Altris AI’s clinical and technical validation withstands the rigorous scrutiny of Health Canada’s regulatory review process, which evaluated the platform across five critical dimensions: clinical evidence supporting efficacy and safety claims; risk management protocols; cybersecurity safeguards; quality management systems; and intended use claims. Each of these pillars reflects the standard that modern AI-driven medical devices must meet before being trusted in clinical settings.
Altris AI’s platform serves optometrists, ophthalmologists, and pharmaceutical organizations by providing intelligent, reliable support for interpreting OCT scans — one of the most widely used diagnostic tools in eye care. By surfacing clinically relevant findings with speed and precision, Altris AI empowers clinicians to make more informed decisions, improve patient outcomes, and increase the efficiency of ophthalmic workflows.

“This approval is external confirmation that our platform meets the standards required for medical-grade AI,” said Maria Znamenska, Chief Medical Officer at Altris AI. “Health Canada’s review is thorough, evidence-based, and internationally respected. Receiving this clearance validates not just our technology, but the entire approach we’ve taken — building AI that clinicians can trust, in environments where accuracy is not optional.”
The Health Canada clearance follows a broader regulatory strategy that positions Altris AI as a compliant, audit-ready platform for healthcare systems worldwide. As global regulators increasingly scrutinize AI in medical devices, early and consistent compliance across multiple jurisdictions will become a decisive competitive differentiator.
Altris AI’s mission is to accelerate the transition of AI in eye care from innovation to infrastructure — not as a replacement for clinical expertise, but as a trusted decision-support layer that elevates the standard of care across every point of practice.
About Altris AI Altris AI is an AI Decision Support platform for OCT analysis, designed to support optometry, ophthalmology, and pharma with clinically validated, regulatory-compliant technology. The company is committed to expanding access to intelligent eye care diagnostics globally.
-
AI in Optometry: 5 Real Applications
Maria Znamenska
9 min.Highlights: AI in optometry is revolutionizing clinical decision-making by allowing eye care professionals to analyse B-scans with greater precision, consistency, and confidence right at the point of care.
- AI for fundus analysis is another way to automatically evaluate fundus scans in an optimized way throughout all devices.
- AI-driven deep learning algorithms can detect and quantify retinal and optic nerve pathologies in OCT images, enabling earlier identification of diseases such as glaucoma, age-related macular degeneration (AMD), and other retinal conditions.
- AI-assisted analysis enhances clinical efficiency by helping clinicians triage scans, monitor disease progression over time, and focus on clinically significant findings, rather than relying solely on manual scan reviews.
- Other AI-powered tools provide objective visual insights for clinicians and patients, improving the accuracy of triage and treatment monitoring and enhancing patients’ understanding of retinal health.
- AI enables optometrists to manage more complex ocular cases in primary care, facilitating earlier detection, risk stratification, and informed referral decisions based on objective insights.
- AI chatbots in optometry inform about eye symptoms, guide whether to seek care (urgent vs. routine), suggest possible conditions, support patients and help decide next steps, etc. Or manage eye care specialists’ daily routine.
Introduction
Artificial intelligence is increasingly shaping healthcare by enhancing clinicians’ ability to interpret complex medical data and make earlier, more informed decisions. AI in optometry is especially important in OCT imaging, where it is essential to correctly interpret subtle structural changes to identify eye disorders early.
AI for optometrists can therefore more reliably and consistently detect and track retinal and optic nerve disorders by integrating deep learning into OCT data. In routine optometric practice, risk management and referral decision-making are enhanced by converting OCT images into understandable, actionable findings.
Discover how optometry AI tools redefine optometry by improving diagnostic accuracy, clinical efficiency, and the quality of patient care in 5 real cases.
1. AI Decision Support for OCT Analysis
One of the most effective AI applications in optometry is AI decision support for OCT analysis.
AI decision-support systems are increasingly applied to OCT imaging to assist optometrists in interpreting complex retinal and optic nerve data. Here’s one of the real cases when AI brings ultimate use to practitioners:
Thus, AI-powered platforms like Altris use deep learning algorithms to automatically detect and quantify structural changes, highlight areas of concern, and track progression over time via an AI OCT pathology detection tool.
By analysing patterns across large datasets of retinal scans, the system can flag subtle abnormalities that may be difficult to identify manually, segment them automatically, and provide structured, visual insights that help clinicians make more informed, consistent decisions while monitoring patient eye health. It does everything eye care specialists do, but faster, error-free, and unbiased.
In particular, Altris AI also applies deep learning to OCT scans to automatically detect and highlight complex retinal and optic nerve changes.
The system quantifies abnormalities, tracks progression over time, and provides visual insights that help optometrists interpret scans more accurately and consistently, again supporting far more informed clinical decisions.
2. AI for Fundus Analysis
AI for Fundus Analysis is another way to automatically evaluate fundus scans in an optimized way throughout all OCT devices. Among the top 3 AI software solutions for fundus imaging, there are:
Auroraa AI (Optomed) is an advanced artificial intelligence platform integrated with Optomed’s handheld and tabletop fundus cameras, designed to detect multiple retinal abnormalities including diabetic retinopathy, glaucoma, and age‑related macular degeneration; it provides immediate, automated screening results to support clinicians and improve early disease detection.
Beammed’s AI‑powered fundus cameras pair intelligent image analysis with portable retinal imaging to enable early detection of diabetic retinopathy and other retinal conditions, leveraging deep learning algorithms to highlight pathology and help streamline screening programs.
Cybersight AI (Orbis) offers an AI‑driven diagnostic support tool focused on interpreting fundus images to assist eye care providers in low‑resource settings and telemedicine programs, combining machine learning with expert clinical guidance to improve access to retinal disease screening globally. Here’s how fundus tool may look like:
Such systems provide severity scores, highlight areas of concern, and track changes over time, giving clinicians objective, reproducible insights to support their decisions. Since AI can detect early signs of conditions like glaucoma, diabetic retinopathy, and age-related macular degeneration, it often spots subtle changes that are hard to see with the naked eye.
3. AI for Automated Visit Scheduling
AI‑powered appointment scheduling systems are digital tools that, alongside any modern AI OCT pathology detection tool or similar, use artificial intelligence — including natural language processing (NLP), predictive analytics, machine learning, and automated communication — to handle clinical scheduling tasks usually done manually by staff. These tools can:
- let patients self‑schedule online, by chat, voice, or text at any time,
- automatically confirm, remind, reschedule, or cancel appointments,
- optimize schedules based on provider availability and patient needs, and
- predict and prevent clinic inefficiencies such as no‑shows.
In essence, the system acts as a digital receptionist and smart scheduler, integrating with clinic practice management software, EHRs, and CRM systems to manage workflows seamlessly. Best EHR systems include:

Elation EHR is a cloud-based electronic health record designed primarily for independent primary care practices. It focuses on simplifying clinical workflows, documentation, and patient engagement, with strong charting tools and longitudinal patient records. It’s used to help physicians deliver personalized care while reducing administrative burden.
Epic is one of the most widely used enterprise EHR systems globally, typically implemented by large hospitals and health systems. It integrates clinical, administrative, and billing functions into a single platform, supporting everything from patient records to population health management. It’s used to coordinate care at scale and improve interoperability across departments and organizations.
Tebra combines electronic health records with practice management, billing, and patient communication tools, targeting small to mid-sized medical practices. It streamlines front-office and clinical operations in one system, helping practices manage scheduling, documentation, and revenue cycle efficiently.
Nextech EHR is a specialty-focused EHR designed for fields like ophthalmology, dermatology, and plastic surgery. It includes tailored templates, imaging integration, and workflow tools specific to these specialties. It’s used to enhance clinical efficiency and documentation accuracy in specialized practices.
InSync EHR is a cloud-based EHR built for behavioral health and therapy practices. It supports telehealth, scheduling, documentation, and billing, with features tailored to mental health workflows. It’s used to improve care coordination and streamline operations for therapists and behavioral health providers.
These tools are designed to improve operational efficiency, reduce administrative burden, and enhance the patient journey in healthcare settings. They offer 24/7 availability, personalized booking flows, and real-time updates, making them a powerful part of your workflow.
ModMed EMA (Electronic Medical Assistant) is an AI-driven, specialty-specific EHR developed by Modernizing Medicine. It uses structured data and adaptive templates to support clinical decision-making and documentation. It’s used by specialists to increase efficiency, improve outcomes, and reduce time spent on manual data entry.
“Up to 71% of U.S. hospitals now use predictive AI technologies for scheduling and related automation.”
Indeed, AI in optometry for appointments, self-scheduling, and other administrative tasks can optimize routine workflows and offer a range of benefits for both opticians and their visitors. They:
- Remove Administrative Burden
AI takes over repetitive scheduling tasks — booking, confirmations, cancellations, preregistration, and follow‑ups — freeing front‑desk staff and nurses to focus on patient care rather than paperwork.
Historically, nurse managers and front‑desk staff can spend up to 40% of their day on scheduling tasks, and automating this saves hours of labour.
- Provide 24/7 Booking & Patient Flexibility
Patients no longer have to call during office hours. AI scheduling tools enable self‑service booking, changes, and cancellations at any time via chatbots, voice interfaces, or online portals.
This has become especially crucial, as 40% of healthcare appointments are requested outside normal business hours — times when traditional phone booking is impossible.
- Reduce No‑Shows & Better Attendance
Automated reminders — via SMS, email, or voice — consistently reduce no‑show rates, which can otherwise waste clinic time and revenue. Clinics using these tools have reported:
-
No‑shows dropped from 20% to as low as 7% with automated reminders.
-
In some settings, AI virtual assistants reduced missed visits by up to ~73%.
AI can also predict patients likely to skip visits and prompt engagement before issues arise.
- Enhance Resource Use
Instead of manually guessing who should be booked and where, such AI in optometry:
✔ matches patients with the right clinician,
✔ avoids double bookings and schedule conflicts,
✔ spreads appointments evenly to reduce bottlenecks, and
✔ improves utilization of staff time and rooms.
AI scheduling can increase provider utilization by 15–25% and reduce wait times by 15–30%.
- Improve Patient Experience
Patients appreciate convenience. Access to online or chatbot booking correlates with improved satisfaction — one study showed satisfaction scores can rise by over 20% when patients can self‑manage appointments.
AI also reduces inbound phone volume by 25–40%, allowing clinics to serve patients more efficiently.
For instance, Tele-optometry decision support that offers
- AI pre-analyses remote exams
- Flags cases requiring in-person referral
- Supports non-specialist reviewers
has the following workflow impact:
- Scales remote care
- Consistent quality
- Faster review cycles
Used in:
- Large optometry chains
- Retail vision centres
- Franchise-based practices
- Rural clinics
- Community health centres
- Mobile eye clinics, etc.
4. AI Workflow & Practice Optimization
So, AI-assisted OCT analysis has become helpful in retina & glaucoma screening, in follow-ups, progression tracking, and other workflows. Meaning, what happens with OCT with the help of an AI OCT pathology detection tool is helpful in many ways:
- OCT scans are automatically analysed
- Pathologies are flagged (fluid, thinning, progression risk, etc.)
- Clinicians review AI output before raw scans.
So, they get
- Faster exam review
- Fewer missed subtle findings
- Consistent interpretation across doctors, etc.
But real-world AI applications in optometry for clinic management do not stop there: scheduling, reminders, patient triage, administrative automation, analytics, and beyond may also be supported by specific optometry AI tools. Here are a few examples.
AI triage tools for urgent eye issues
- AI pre-screens OCT/fundus images
- Exams are auto-prioritized by severity
- High-risk patients are flagged before the visit
Workflow impact:
- Smarter scheduling
- Faster routing to specialists
- Less cognitive load on staff
Used in:
- High-volume optometry chains
- Tele-optometry services
An example of AI diagnostic software for optometry and ophthalmology can be IDx-DR AI Diagnostic System for Detecting Diabetic Retinopathy.
Automated appointment reminders
Automated appointment reminders are AI- or rules-based systems, not yet independent chatbots or AI assistants, that automatically notify patients about upcoming eye exams via SMS, email, WhatsApp, or voice calls, without staff involvement.
They usually trigger:
- 7 days before (prep + reschedule window)
- 48–72 hours before (confirmation)
- 24 hours or same day (final reminder)
which makes them still a new generation of automation tools for eye care. Well-designed systems, like the majority of AI in optometry tools, support:
- HIPAA / GDPR-compliant messaging
- No clinical advice in reminders
- Audit logs of sent communications
- Opt-out controls
This makes them safe for both routine and medical eye care appointments.
For example: EyeCloudPro
But why do no-shows happen in optometry? Like in any other service sphere, there are real reasons why:
- Routine exams feel “non-urgent.”
- Long booking lead times (2–6 weeks)
- Patients forget dilation/prep requirements
- Elderly patients miss calls or misremember dates
- Parents forget pediatric appointments
- No easy way to confirm or reschedule
Across outpatient care (including optometry), automated reminders typically achieve:
- 20–40% reduction in no-shows
- 5–10% increase in appointment confirmations
- Up to 30% fewer last-minute cancellations
- 1–2 hours/day staff time saved (no manual calls)
In optometry specifically, clinics with long routine exam cycles often see results closer to the upper end of those ranges. What automated reminders do here is directly target forgetfulness + reduce friction. No ordinary staff can do that to such an extent. But AI can.
Therefore, by keeping patients aware, ready, and involved, automated appointment reminders help optometry clinics reduce no-show rates. Practices may increase patient flow, maximize chair time, and enhance attendance by providing timely, customized notifications through preferred channels—all without adding to the administrative burden.
Patient communication and optometrists’ education appsPatient communication, as well as optometrist education systems and applications, for mobile and desktop usage, support clearer understanding, better engagement, and more consistent care delivery.
For example: Chatbots in Healthcare from Capacity
These tools help patients understand their eye health and treatment plans, while enabling optometrists to stay informed through structured education, clinical updates, and decision-support resources—improving outcomes without increasing chair time:
- AI translates OCT findings into plain language
- Visual overlays show “what changed” and “why it matters.”
- Used chairside or via patient portal
Workflow impact:
- Better patient understanding
- Higher treatment acceptance
- Shorter explanation time per visit
Used in
- Routine eye exams
- OCT review appointments
- Retina & glaucoma visits
- Anti-VEGF treatment discussions
- Glaucoma therapy initiation
- Long-term monitoring plans, etc.
Altris Education application, as an example of a unique tool specifically designed for eye care specialists’ training:
5. Chatbots for Consultation
A separate category is AI chatbots and virtual assistants that help with patient follow-up, education, and communication, improving day-to-day patient communication and more. With the AI Help Assistant feature, you can create an AI chatbot trained on your specific content from any platform you like. Chatbots for consultation in optometry offer clear, practical benefits for both clinics and patients:
- 24/7 Q&A
- Absolutely personalized follow-up instructions
- Higher patients satisfaction rate
Furthermore, they provide instant, 24/7 responses to the most common eye-care questions, helping patients understand symptoms, prepare for visits, and follow post-exam instructions without even waiting for staff availability.
Chatbots can assist with pre-consultation triage by gathering symptoms, visual complaints, and medical history, allowing optometrists to focus on higher-value clinical tasks.
They also improve patient engagement and adherence by delivering personalized education, reminders, and care instructions in simple, easy-to-understand language.
Overall, optometry chatbots dramatically reduce administrative workload, shorten response times, and support more efficient, patient-centered care while maintaining consistent communication quality.
Types of Chatbots in Eye Care & Optometry
1. Symptom & Triage Chatbots
These ask users about eye symptoms, guide whether to seek care (urgent vs. routine), suggest possible conditions, and help decide next steps. Example: Ada Health
A study published in Eye showed that large‑language‑model‑based chatbots (e.g., ChatGPT) could answer common ophthalmology questions with high accuracy and clarity — scoring higher than alternative generative models for diagnostic and triage‑related queries (accuracy and comprehensiveness metrics showed ChatGPT did well on standard patient questions).
Another clinical evaluation found that AI (GPT‑4) correctly identified the appropriate diagnosis among the top three options in up to 93% of ophthalmology cases and correctly assessed urgency levels in most cases — performance comparable to that of trainees.
2. Real‑World Chatbots for Eye Care
The patient describes eye symptoms and uploads images (e.g., photos or OCT scans).
An AI assistant organizes symptoms and images for review, then a real ophthalmologist chats with the patient to guide care. Key inputs here:
- Collect symptoms in natural language
- Translate or clarify reports
- Help the clinician interpret visuals and decide next steps
It combines AI symptom intake with real human consultation, making remote triage efficient.
AI in optometry real chatbot examples:
- WebEyeClinic / Visio — symptom intake & remote clinician chat
- VisionCare Assistant — eye health guidance
- DocsBot AI — practice support
- Custom AI agents via Voiceflow — administrative automation, etc.
3. DocsBot AI for Optometry Services
Practice‑focused chatbot helping clinics answer FAQs, provide pre‑appointment instructions, and automate patient engagement. Benefits:
• Instant responses to common patient queries
• 24/7 availability for basic information
• Can free up staff time by handling routine communication, such as allowing self-booking, etc.“Patients express high satisfaction with AI self‑booking capabilities (up to 85% positive ratings).”
Here are some more real AI chatbot applications in eye care:
Tool / Platform Primary Focus DocsBot AI Patient FAQs & practice engagement ThriveDesk AI AI customer support for optometry Voiceflow AI Agent Custom appointment/scheduling chatbot MedReception AI Manage eye exams, contact lens orders, and optical retail coordination OptoAI AI Assistant Knowledge and clinical support agent Pod AI AI phone/communication agent As highlighted, there is a wide array of chatbot types in optometry, ranging from patient-facing virtual assistants to AI-powered communication platforms.
With features such as automated appointment scheduling, pre-visit coaching, FAQ handling, 24/7 patient engagement, and basic clinical decision support, these optometry AI systems offer substantial value.
By streamlining administrative tasks and improving patient education, these AI chatbots free up clinicians’ time to focus on direct care.
Overall, the integration of AI-driven chatbots is revolutionizing the delivery of eye care. They enhance operational efficiency, reduce missed appointments, support timely patient triage, and improve adherence to care plans. By combining automation with intelligent decision support, AI not only optimizes clinic workflows but also elevates patient outcomes and satisfaction, marking a transformative shift in modern optometry practice.
Conclusion
AI is rapidly becoming a practical and valuable tool in optometry, particularly for analysing OCT imaging. By enabling more consistent interpretation of complex retinal and optic nerve data, AI in optometry supports earlier identification of disease-related changes, more efficient triage, and improved longitudinal monitoring.
Beyond clinical efficiency, AI enhances patient communication by translating OCT findings into clear visual insights, supporting better understanding and engagement. As a result, optometrists are better equipped to manage more complex cases in primary care, make informed referral decisions, and deliver higher-quality, data-informed eye care—positioning AI as a meaningful complement to clinical expertise rather than a replacement.
FAQs
Is AI for optometry safe?
AI in optometry is generally safe when it is properly validated, regulated, and used as a clinical support tool rather than a replacement for professional judgment. It can improve screening accuracy, enable earlier detection of eye diseases, and streamline workflows, but it also carries risks such as diagnostic errors, data privacy concerns, and bias if systems are poorly trained or over-relied upon. For safe use, optometrists must remain responsible for final decisions; patients should be informed when AI is involved; and tools should comply with medical regulations (such as FDA or CE approval) and data protection standards, such as GDPR or similar, depending on the region.
What’s an AI OCT pathology detection tool?
An AI OCT pathology detection tool is a software system that uses artificial intelligence to analyse optical coherence tomography (OCT) images of the eye and automatically identify signs of disease, such as macular degeneration, glaucoma, or diabetic retinopathy; it assists clinicians by highlighting abnormalities and suggesting potential diagnoses, but it is designed to support—rather than replace—professional interpretation, and its safety and effectiveness depend on proper validation, regulatory approval, and clinician oversight.
Can AI help reduce no-shows and long wait times in an optometry practice?
Yes. AI applications in optometry are limitless. AI can help reduce no-shows and long wait times in optometry practices by supporting appointment scheduling, reminders, and workflow optimization—such as identifying scheduling patterns, highlighting bottlenecks, and enabling more efficient patient flow—while assisting staff with better resource planning and communication.
What can chatbots and AI assistants do for an optometry practice?
Chatbots and AI assistants can help an optometry practice automate patient communication, streamline scheduling, and improve clinical efficiency by answering FAQs 24/7, booking and confirming appointments, sending reminders, pre-screening patients with symptom checkers, collecting medical history before visits, and triaging urgent cases. They can also support front-desk staff by handling insurance questions, guiding patients to the right services (e.g., OCT, glaucoma screening, contact lens exams), following up after visits, and reactivating inactive patients through personalized messaging. Internally, AI in optometry assistants can summarize patient data, flag high-risk cases, analyse trends in no-shows or referrals, and help with marketing automation — ultimately reducing administrative workload, improving patient satisfaction, and increasing practice revenue.
What kinds of clinical or diagnostic support can AI provide in eye exams?
AI can support eye exams by assisting with image review, pattern recognition, and data organization—such as highlighting features in retinal images, supporting consistency in exam review, and providing quantitative reference information—while remaining a complement to clinician judgment rather than a replacement for clinical decision-making.
How can AI increase optical revenue and overall patient satisfaction?
AI in optometry can increase optical revenue and patient satisfaction by helping practices streamline workflows, reduce wait times, support personalized patient communication, and enhance the in-practice experience through clearer visualization and education tools—leading to more efficient operations, improved engagement, and higher-quality service delivery.
References:
Luhmann, U. F. O. (2015). Innate immunity in age-related retinal degeneration. Acta Ophthalmologica. https://doi.org/10.1111/j.1755-3768.2015.0144
https://remidio.us/solutions/teleophthalmology-telehealth/
https://medpick.in/product/idx-dr-ai-diagnostic-system-for-detecting-diabetic-retinopathy/
https://www.rcophth.ac.uk/academic-and-research/eye-journal/
https://webeyeclinic.com/how-it-works/
https://docsbot.ai/industry/optometry-services
https://www.voiceflow.com/ai/optometrists
https://healthus.ai/service/ai-chatbot-appointment-module/
https://arxiv.org/abs/2511.09394
https://ajbsr.net/data/uploads/6387.pdf
-
Altris becomes the winner of VSP Vision Challenge at Vision Expo
 Altris In
ORLANDO, FL — Altris, an IMS for OCT analysis with ROU AI models, has been named the Judge’s Winner of the 2026 VSP Vision Innovation Challenge, one of the eyecare industry’s most prestigious startup competitions. The award was presented live on March 13, 2026, on the Innovation Stage at Vision Expo inside the Orange County Convention Center in Orlando, Florida.
Produced by RX and The Vision Council in collaboration with VSP Vision™, the 2026 VSP Vision Innovation Challenge drew applications from companies around the globe — more than half of which were venture-backed, collectively representing over $300 million in funding. After a rigorous selection process, Altris AI was chosen as one of four finalists and participated in an intensive four-week startup bootcamp before delivering a live pitch to a distinguished panel of industry judges.
Judges recognized Altris for its clinical impact, technological sophistication, and potential to fundamentally transform the eyecare experience. The judging panel represented a diverse cross-section of industry leaders, including executives, clinicians, and investors.
“Winning the VSP Vision Innovation Challenge is a powerful validation of what we’re building at Altris AI. Our mission is to put the most advanced retinal intelligence in the hands of every eye care professional — and this recognition from a world-class panel of judges confirms that the industry is ready for this transformation.”
Altris AI CEO, Andrey Kuropyatnyk
About Altris
Altris AI serves as a “second set of eyes” for eye care specialists, identifying more than 70 retinal biomarkers from optical coherence tomography (OCT) scans ( AI models are used for Research Use Only). The platform enables providers to match patients to the most appropriate treatments, devices, and clinical trials with objective, data-driven precision. Altris system is FDA-cleared and HIPAA-compliant, and integrates seamlessly with OCT scanners from nine major manufacturers.
By combining advanced deep learning algorithms with a clinically intuitive interface, Altris AI reduces diagnostic variability, supports earlier detection of sight-threatening conditions, and frees eye care professionals to focus on what matters most: patient outcomes.
About the VSP Vision Innovation Challenge
The VSP Vision Innovation Challenge is a global competition designed to source, support, and accelerate early-stage startups and technologies advancing the eyecare experience. This year’s finalists represented a broad spectrum of innovation — from AI-driven diagnostics and exam automation to digital education and accessibility-focused smart solutions.
In addition to pitching live, finalists exhibited at Vision Expo’s Innovation Center, a dedicated emerging-technology destination featuring more than 20 next-generation startups spanning AI, augmented and virtual reality, and advanced diagnostics.
“Innovation in eyecare is accelerating, which is why it’s crucial for the industry to stay actively engaged. We launched the VSP Vision Innovation Challenge to connect emerging technologies with the stakeholders they aim to serve, and this year is no exception. We’re proud to support solutions that advance care for both providers and patients.”
— Will Flanagan, Head of VSP Global Innovation Center Programs and Partnerships
Looking Ahead
With this recognition, Altris AI continues to accelerate its mission of making retinal AI accessible to every eye care professional. The company will leverage the visibility and industry connections gained from the challenge to deepen partnerships with providers, expand clinical integrations, and advance its platform’s capabilities.
The next VSP Vision Innovation Challenge will take place at Vision Expo 2027, scheduled for March 10–13 in Las Vegas. Applications are expected to open later this fall.
About Altris Inc.
Altris AI is a clinical-grade SaaS platform that empowers eye care specialists with AI-driven retinal analysis. By identifying 70+ retinal biomarkers from OCT scans, Altris AI helps providers deliver more precise, evidence-based care. The platform is FDA-approved, HIPAA-compliant, and compatible with OCT devices from nine leading manufacturers.
-
Altris Inc.
Altris AI Receives Health Canada Approval, Reinforcing Its Position as a Globally Trusted AI Decision Support Platform for OCT Analysis
Regulatory clearance marks a pivotal milestone in Altris AI’s international expansion and its mission to bring clinical-grade AI to eye care worldwide.
10 March 2026 — Altris AI, a leading provider of AI-powered decision support for optical coherence tomography (OCT) analysis, today announced it has received approval from Health Canada | Santé Canada, Canada’s federal health regulatory authority. This clearance represents a significant step forward in the company’s global growth strategy and its commitment to meeting the highest standards of medical device safety and clinical reliability.
For a company scaling across international markets, regulatory approvals are far more than administrative milestones — they are foundational growth enablers. Health Canada approval strengthens Altris AI’s international positioning, opens new pathways for future regulatory submissions across key markets, and delivers a clear signal to the global healthcare community: Altris AI is built for real-world clinical practice.
The approval confirms that Altris AI’s clinical and technical validation withstands the rigorous scrutiny of Health Canada’s regulatory review process, which evaluated the platform across five critical dimensions: clinical evidence supporting efficacy and safety claims; risk management protocols; cybersecurity safeguards; quality management systems; and intended use claims. Each of these pillars reflects the standard that modern AI-driven medical devices must meet before being trusted in clinical settings.
Altris AI’s platform serves optometrists, ophthalmologists, and pharmaceutical organizations by providing intelligent, reliable support for interpreting OCT scans — one of the most widely used diagnostic tools in eye care. By surfacing clinically relevant findings with speed and precision, Altris AI empowers clinicians to make more informed decisions, improve patient outcomes, and increase the efficiency of ophthalmic workflows.
“This approval is external confirmation that our platform meets the standards required for medical-grade AI,” said Maria Znamenska, Chief Medical Officer at Altris AI. “Health Canada’s review is thorough, evidence-based, and internationally respected. Receiving this clearance validates not just our technology, but the entire approach we’ve taken — building AI that clinicians can trust, in environments where accuracy is not optional.”
The Health Canada clearance follows a broader regulatory strategy that positions Altris AI as a compliant, audit-ready platform for healthcare systems worldwide. As global regulators increasingly scrutinize AI in medical devices, early and consistent compliance across multiple jurisdictions will become a decisive competitive differentiator.
Altris AI’s mission is to accelerate the transition of AI in eye care from innovation to infrastructure — not as a replacement for clinical expertise, but as a trusted decision-support layer that elevates the standard of care across every point of practice.
About Altris AI Altris AI is an AI Decision Support platform for OCT analysis, designed to support optometry, ophthalmology, and pharma with clinically validated, regulatory-compliant technology. The company is committed to expanding access to intelligent eye care diagnostics globally.
-
Drusen on OCT: Detection, quantification, and tracking
 Maria Znamenska
5 min.
Maria Znamenska
5 min.Introduction
Drusen remains one of the main biomarkers of age-related macular degeneration (AMD). They play a prognostic role and reflect the stage of the disease. Distinguishing drusen parameters provides a personalized risk profile for the transition to geographic atrophy or neovascular AMD. Everyone working with AMD patients should know how to detect, quantify, and track drusen on OCT.
What are the types of drusen?
Drusen are accumulations of pathological material of lipid-protein nature, localized under the PES. They reflect impaired transport and exchange between the retinal pigment epithelium and Bruch’s membrane. Historically, they are divided into hard, soft, reticular pseudodruses (or subretinal drusenoid deposits) and other less common types (confluent, pachidruses) as well as other retinal OCT biomarkers for drusen segmentation.
Hard drusen
On ophthalmoscopy, they are small, rounded, clearly delineated foci of yellowish-white color. On OCT, they look like local deposits of hyperreflective material under the PES with a diameter of no more than 63 microns. In small quantities (up to 8), they are not a sign of pathology. They are asymptomatic in most patients.
Soft drusen
Soft drusen are larger than hard drusen and appear as extensive foci with blurred edges on the fundus. On OCT, they are dome-shaped and elevated above the PES and are divided into medium (63-125 μm) and large (more than 125 μm) in size. They are more strongly associated with AMD progression, especially when accompanied by pigmentary abnormalities and other OCT biomarkers (hyperreflective foci, destruction of the ellipsoidal zone, etc.). Soft drusen can enlarge and merge. An area of merging drusen with a diameter exceeding 350 μm is called a drusenoid detachment of the PES.
Soft drusen detected by Altris IMS. AI models are for Research Use Only. Not for use in diagnostic purposes.
Confluent drusen
These are multiple small deposits under the PES, which can occur in relatively young patients; on FAG they often show a “starry sky” appearance. On OCT, there are multiple small symmetrical elevations of the PES, small in diameter (like hard drusen), but more numerous, prone to merging. The course is variable: some patients maintain a stable course for years, some have an increased risk of complications and transition to the late stages of AMD.
Reticular pseudodrusen (or subretinal drusenoid deposits)
They differ fundamentally in their localization, being located above the PES (in the subretinal space). They contain some common proteins with soft drusen, but differ in lipid composition. Due to their close location to the important photoreceptor layer, they are more often combined with a decrease in visual function, and also carry a higher risk of progression to late AMD (especially characterized by a rapid transition to geographic atrophy (GA) and the development of macular neovascularization (MNV) type 3).
What are the levels of drusen?
The AREDS size classification is still useful in clinical practice: small <63 μm, medium 63–124 μm, large ≥125 μm. Analyses confirm that the 5-year risk of progression to late AMD increases with the number and size of drusen in both eyes and especially with the presence of reticular pseudodrusen. In the NICE guidance for the management of patients with AMD (2018), the risk of progression also depends on the size and type of drusen, as well as the presence of associated pathological changes (pigmentary abnormalities, vitelliform deposits).
The OCT era has added powerful quantitative metrics with AI for drusen measurement and monitoring:
- drusen height (μm),
- area (mm²),
- volume (mm³),
- topography (central ring within 1.5 mm; parafovea 3–5 mm),
- dynamics of changes and associated biomarkers (hyperreflective foci, ellipsoidal zone disruption, presence of hypertransmission zones, etc.).
A practically significant increase in the volume of drusen in the macular region over a year/two correlates with structural and functional deterioration (destructive changes in the photoreceptor layer, changes in ONL thickness, visual acuity). Data from multicenter projects (such as MACUSTAR) confirm the repeatability of measurements and the possibility of comparison between devices, provided that the correct algorithms are used.
What do drusen look like on OCT?
On B-scan OCT, classic hard and soft drusen are localized deposits of hyperreflective material between the PES and Bruch’s membrane (under the PES). Reflectivity can be uniform or heterogeneous depending on the structure and stage of development. Reticular pseudodruses are localized between the photoreceptor layer and the PES (above the PES) – this is the key difference from conventional drusen. On OCT images, they appear as tubercles in the subretinal space that remodel the outer layers of the retina (in particular, the ellipsoidal zone), and on en face, they are visualized as punctate structures, usually connected in a mesh pattern.

A: Soft drusen. B: Hard drusen (Source) Another classic white and black scan
In addition to the drusen themselves, clinically significant are hyperreflective foci, destruction of the ellipsoidal zone, thinning of the outer layers/ONL, formation of hyperreflective foci in OCT or geographic atrophy with the effect of hypertransmission – it is the combinations of these features that form prognostic models of the transition of intermediate AMD to late stages. The combination of these biomarkers consistently exceeds single morphometric thresholds.

En Face Optical Coherence Tomography Illustration of the Trizonal Distribution of Drusen and Subretinal Drusenoid Deposits in the Macula (Source)
As we can see, en face and linear OCT scans help to differentiate different types of drusen and track their progression dynamics. Modern deep learning models for AI drusen examination and en face analysis, like Altris.AI, reliably detect and segment classic drusen from subretinal drusenoid deposits, improving repeatability and reporting speed. You may see the difference from the classic white and black image analysis here:

Confluent drusen are highlighted by Altris IMS. AI models are used for Research Use Only. Not for use in Diagnostic Purposes.
How to measure drusen size?
Here we can find how drusen are measured:
1) Classical size scale (AREDS):
Orientation on diameter or equivalent on planar reconstructions: <63, 63–124, ≥125 μm. Convenient, but does not take volume/height or topography into account.
2) Quantitative OCT analysis of PES elevation:
On ZEISS CIRRUS instruments, the Advanced RPE Analysis module automatically calculates the area and volume of PES elevation in standard 3 and 5 mm rings around the fovea; the minimum height that the system consistently includes in quantitative results is about 19–20 μm. This provides repeatable metrics and a common “language of numbers” for clinical and research purposes.
3) Morphometric rule for differentiation of drusen and drusenoid detachment of PES:
By basal width: <350 μm – drusen, ≥350 μm drusenoid detachment of PES.
4) AI segmentation and 3D morphometry:
Deep networks segment Bruch’s membrane, PES, and ellipsoidal zone, as well as PES elevation on OCT, calculating drusen height/area/volume and generating dynamics maps. Validation work in 2023–2025 will demonstrate robustness between different OCT devices, which is critical for multicenter networks. Besides, you may track drusen progression on OCT AI tool and stay informed ahead of time to prevent more severe pathology changes in advance.
Can drusen exist without macular degeneration?
Yes, and this is possible in the following cases.
Small (<63 μm) single drusen may occur in the elderly in the absence of other signs of AMD and concomitant risk biomarkers (hyperreflective foci, ellipsoidal zone abnormalities). In this phenotype, the 5-year risk of progression is low; routine monitoring at an interval of 1 time per year is sufficient, if possible, with recording quantitative indicators on OCT (volume/area of PES elevation) for comparison in dynamics. The patient should be informed that the fact of “small drusen” alone does not equal a diagnosis of AMD and does not require treatment, but it is advisable to maintain lifestyle modification (blood pressure control, smoking cessation, a healthy diet).
Confluent drusen are sometimes found in younger patients; they do not always fit into the classic models of AMD. Tactics – individual observation with an emphasis on high-quality OCT documentation (the same scan and control of concomitant biomarkers). In the absence of “red flags”, a 6-12 month follow-up interval is sufficient.

Understanding Macular Degeneration (Source)
Hereditary dystrophies (EFEMP1-related; associated phenotypes are Doyne’s cellular degeneration of the retina and Leventis’ malady) form drusen-like deposits without the typical pathogenesis inherent in AMD. They have an autosomal dominant inheritance pattern and are characterized by yellow-white deposits, like drusen, accumulating under the PES, often in the peripapillary zone. The clinical picture may include gradual vision loss, impaired contrast sensitivity, or metamorphopsia. In this case, timely detection of the phenotype (age of onset, family history, symmetry, characteristic fundus appearance) and referral for medical and genetic counseling with a subsequent individual follow-up plan, including monitoring of possible complications (neovascularization, atrophic changes).
Drusen vs. drusenoid detachment of PES
Drusen are local elevations of PES above Bruch’s membrane due to deposits of pathological material under PES. Usually multiple, of different diameters, with a tendency to merge with the formation of larger, topographically continuous areas of PES elevation.
Drusenoid detachment of the pigment epithelium is formed from a larger conglomerate of drusenoid material, which in turn is formed as a result of the fusion of drusen.

Another differentiating drusen and drusenoid deposits subtypes on multimodal imaging samples
On B-scan OCT, it has smooth edges, uneven reflectivity, and often retains communication with neighboring drusen. On en face visualization, a conglomerate of elevation is visible, which corresponds to the zone of changes in the PES-Bruch’s membrane complex. In the absence of fluid inside the lesion, we are talking about drusenoid detachment of PES; if homogeneous hyporeflectivity is visualized under PES, this is serous detachment of PES, and if there are signs of a neovascular membrane according to OCTA or FAG, this is fibrovascular detachment of PES. Therefore, in doubtful cases, it is advisable to add OCTA to exclude hidden MNV.
The main morphometric rule: basal width ≥350 μm (in the horizontal projection of the OCT slice favors drusenoid detachment of PES. In some situations, we also pay attention to the content (serous/optically empty space, signs of vascularization), PES profile, and associated biomarkers, since PES detachment is more often associated with the risk of transition to HA or the formation of neovascularization.
What is the best treatment for drusen?
Drusen are not treated as a separate nosology. They are a structural biomarker of AMD, and also have prognostic value for assessing the further development and rate of progression of the disease.
Optimal tactics for detecting drusen:
Optimal tactics for detecting drusen may include the following
Risk modification:
- smoking cessation,
- blood pressure control,
- metabolic profile,
- diet.
Dietary supplements based on AREDS 2:
- taking antioxidant complexes (lutein, zeaxanthin, vitamins C and E, zinc, copper) reduces the risk of transition to late AMD by approximately 25% within 5 years (according to AREDS 2).
Quantitative monitoring on OCT:
- record the volume/area/height of drusen and their dynamics, distinguish between drusen types, detect other concomitant signs of AMD progression (hyperreflective foci, destructive changes in the ellipsoidal zone, pigmentary anomalies, vitelliform material deposition, signs of formation of foci of geographic atrophy).
- Individualize observation intervals (depending on the type of drusen, the dynamics of their structural changes and other risk factors).
- Among the new promising methods of treating dry AMD at the drusen stage is multiwavelength photobiomodulation.
Multiwavelength photobiomodulation:
This method is aimed at stopping or regressing the progression of dry AMD by modulating mitochondrial activity and consists of the use of specific light (red and near-infrared spectrum from ~590 to 850 nm), which can reduce oxidative stress in retinal cells, inflammation and apoptosis of PES cells.
The efficacy as a potential treatment approach has remained controversial until recently: studies have shown only temporary improvement in visual function and reduction in drusen volume (not maintained for 6 months).
Updated data from the LIGHTSITE III study were presented at the ARVO 2025 conference. They showed that photobiomodulation can significantly slow the decline in visual acuity and reduce the rate of expansion of HA zones
Recently, the FDA approved photobiomodulation for the treatment of AMD.
For complications:
- Neovascular AMD– anti-VEGF.
- Geographic atrophy – injectable drugs (inhibitors of the C3 and C5 complement system), approved by the FDA
The role of AI drusen quantification OCT
The role of AI: automated drusen-volume measurement in OCT is now a reality. IT allows automated segmentation and counting (3D volume, area, height), identification of reticular pseudodruses and other signs of AMD, and compilation of prognostic profiles.
In practice, applying an OCT drusen-counting algorithm reduces variability in assessments and helps personalize visit frequency. Additionally, home OCT monitoring models with AI analysis are being developed, indicating that broader AI support for AMD is fast approaching.
Conclusion
Drusen on OCT are more than just a sign of AMD. They have become one of the most important biomarkers of age-related macular degeneration and a kind of “compass” in the daily practice of an ophthalmologist. Today we understand that:
Drusen come in different types, and, accordingly, carry different prognostic information: hard, soft, confluent, and reticular pseudodrusen. Each type carries a different risk and requires a different surveillance strategy.
Drusen levels are no longer limited to diameter, height, volume, dynamics, and structural features as well as accompanying OCT biomarkers have also become important. It is the combination of these parameters that allows us to predict the transition to the late stages of AMD.
OCT has changed the game: drusen can now be seen in 3D, segmented automatically, build PES elevation maps, and compare data between visits. Thanks to this, the doctor receives a lot of information about the evolution of the disease.
AI sets a new standard: algorithms can accurately calculate drusen volume, identify their subtypes, generate prognostic profiles, and reduce interobserver variability. This translates data from subjective descriptions into objective, reproducible numbers.
Drusen classification on OCT using AI allows not only ascertaining the presence of drusen, but also differentiating their type, objectively measuring their number and parameters, and tracking their dynamics via AI drusen quantification on OCT. For the doctor, this means identifying risk factors in the early stages of retinal disease, accurately comparing data between visits, and prescribing the correct therapy promptly.
Home monitoring is the future that has already begun: the first FDA-approved solutions with “OCT + AI” are currently used to monitor fluid in neovascular AMD, but they pave the way for daily structural monitoring of drusen as well. This means that in the near future, the patient may be able to monitor their own retina at home, and the doctor may be able to see the dynamics in real time.
In the treatment of drusen wet or dry AMD, the main goal remains not to “remove drusen,” but to minimize risks (smoking, diet, systemic factors), prescribe AREDS2-based complexes, timely detect complications, and apply already available therapies (anti-VEGF in INM, C3 and C5 inhibitors of the complement system in HA). Among the new promising methods for treating dry AMD at the drusen stage is multiwavelength photobiomodulation.
It is important to remember when communicating with the patient: drusen is not a therapeutic target, but a structural “compass”. We do not “treat drusen.” Instead, we systematically reduce risks (smoking, blood pressure, nutrition), use drugs based on the AREDS2 formula, and most importantly, we regularly measure their quantitative parameters in dynamics. When complications appear and the transition to a late stage occurs, we prescribe treatment based on the same objective OCT metrics. Thus, instrumental accuracy and AI analytics turn drusen into a manageable marker that helps to timely detect the risks of AMD progression.
Thus, drusen on OCT have become a bridge between morphology and prognosis. They provide an opportunity to build a long-term strategy for preserving vision. Today, the doctor is required not only to see drusen, but also to quantitatively measure, assess in dynamics, calculate the risk, and explain to the patient his individual risks. It is thanks to these approaches that we are moving towards a new paradigm – personalized ophthalmology, where decisions are made based on objective digital data, enhanced by artificial intelligence.
Sources:
-
- https://pubmed.ncbi.nlm.nih.gov/39558093/
- https://jamanetwork.com/journals/jamaophthalmology/fullarticle/2765650
- https://link.springer.com/article/10.1007/s00417-024-06389-x
- https://iovs.arvojournals.org/article.aspx?articleid=2804052
- https://www.ophthalmologyscience.org/article/S2666-9145(25)00182-4/fulltext
- https://www.nature.com/articles/s41433-024-03460-z
- https://www.ophthalmologytimes.com/view/arvo-2025-update-on-the-lightsite-iii-study-in-amd
-
Central Retinal Vein Occlusion CRVO OCT: Detection and Modern Approaches to Monitoring and Treatment
Maria Znamenska
3 min.Introduction
Central Retinal Vein Occlusion (CRVO) OCT is one of the most common and clinically significant vascular disorders affecting the eye, often resulting in substantial visual impairment. This condition ranks second among causes of vision loss due to vascular disease, after diabetic retinopathy, placing a considerable burden on both healthcare systems and patients’ quality of life. Epidemiological studies show that the prevalence of RVO increases with age, and in populations with concomitant cardiovascular disease, the risk of developing occlusion rises severalfold.
Despite a long history of study, it is the breakthroughs in instrumental diagnostics over the past decade that have fundamentally changed our approach to recognizing and managing RVO. Previously, assessment of the macula and retinal vasculature relied primarily on ophthalmoscopy. While still an important tool, it has inherent limitations.
Optical coherence tomography (OCT) has revolutionized diagnostic standards. With its high resolution and ability to capture subtle structural changes within the retinal layers, OCT has become indispensable for determining disease severity, monitoring treatment efficacy, and conducting long-term follow-up. It allows for the detection of minimal early signs of edema, subclinical structural damage, and initial manifestations of ischemia—changes that were practically inaccessible for dynamic assessment 10–15 years ago.
This level of precision is particularly critical for patients at increased risk of RVO. The most vulnerable groups include individuals with arterial hypertension, diabetes mellitus, glaucoma, coagulation disorders, as well as older adults, in whom the vascular walls may already have undergone degenerative or sclerotic changes.
Importantly, modern RVO treatments require objective dynamic monitoring. OCT enables precise evaluation of structural changes, tracking of therapeutic response, and individualization of treatment strategies, helping to avoid both overtreatment and undertreatment.
Thus, the role of OCT today goes far beyond simple visualization: it is a key tool for prognostic assessment, patient stratification, optimization of therapeutic decisions, and timely detection of complications.
1. What RVO Is and Why It Occurs?
Central Retinal Vein Occlusion (CRVO) OCT is a disruption of venous blood outflow in the retina due to partial or complete vein occlusion. As a result, the following occur:
- Blood stasis
- Increased venous pressure
- Impaired capillary perfusion
- Retinal edema, especially in the macular area
- Risk of neovascularization
Early detection is critical, as prompt treatment—particularly for macular edema—significantly increases the chances of preserving or restoring vision. Delayed diagnosis can lead to progression of ischemia, neovascularization, neovascular glaucoma, and persistent macular dysfunction.
RVO also has important systemic implications: patients with a history of RVO have a higher risk of acute cardiovascular events (myocardial infarction, stroke, heart failure) compared with the general population. This emphasizes the need for comprehensive management, involving not only ophthalmologists but also other specialists, such as cardiologists.
Central vs. Branch Retinal Vein Occlusion: Pathogenesis Differences
- Central Retinal Vein Occlusion (CRVO) occurs when blockage happens at the level of the lamina cribrosa. Compression, arterial wall thickening, or thrombotic processes disrupt blood outflow from the entire retina. Typical signs include:
- Diffuse hemorrhages
- Marked macular edema
- Increased risk of optic disc and iris neovascularization due to severe ischemia
- Generally worsen prognosis than branch occlusions
- Branch Retinal Vein Occlusion (BRVO) usually occurs at arteriovenous crossings, where a thickened artery compresses a vein, causing localized occlusion. Characteristic features include:
- Localized edema and hemorrhages
- Clear segmental distribution
- Prognosis is generally better than that of CRVO, though macular edema may persist
Key Risk Factors for RVO
Modern studies and guidelines identify the following as the main risk factors:
- Arterial hypertension
- Atherosclerosis and age-related vascular changes
- Diabetes mellitus (even without diabetic retinopathy)
- Glaucoma and elevated IOP
- Hypercoagulable states, thrombophilia
- Obstructive sleep apnea
- Age >50 years
Rare cases of RVO associated with thromboembolic complications after COVID‑19 infection or vaccination have also been reported, highlighting the ongoing relevance of thrombotic mechanisms.
Impact on Microcirculation and Vision
RVO leads to:
- Impaired normal venous outflow
- Sharp elevation of hydrostatic venous pressure
- Damage to the blood-retinal barrier
- Leakage of plasma and cellular elements into the retinal interstitium, causing macular edema
- Development of ischemic zones
- Over time, thinning of inner retinal layers, neuroepithelial atrophy, and damage to the photoreceptor layer
These changes are best assessed with OCT, which enables precise patient stratification and treatment planning. Timely diagnosis, proper monitoring, and early therapy are essential.
2. OCT Signs of Retinal Vein Occlusion: Detecting Subtle Changes
With the advent of OCT, detection of structural retinal changes in RVO has significantly improved—even at early stages without obvious clinical signs.
Acute Stage Changes (first weeks after occlusion)
- Macular edema:
- Cystic spaces in inner retinal layers (INL, OPL)
- Increased central retinal thickness
- Subretinal fluid (serous neurosensory detachment)
- Intraretinal hemorrhages: appear on OCT as hyperreflective areas with shadowing of underlying layers
- Ischemia indicators:
- Hyperreflectivity of neuroepithelium
- Cotton-wool spots
Chronic Stage Changes (months later)
- Chronic ischemic and atrophic changes (thinning of inner retinal layers)
- Disruption of photoreceptor layer (ELM and EZ)
- Disorganization of inner retinal layers (DRIL)
- Persistent edema (>6 months) indicates chronic RVO requiring therapeutic adjustment
AI for OCT thus allows both acute diagnosis and long-term monitoring of ischemic progression or tissue remodeling.


3. Assessment of Macular Changes in RVO Using OCT
Central retinal vein occlusion crvo OCT is now considered the gold standard for diagnosing, monitoring, and assessing treatment response in macular edema, including that associated with RVO.
OCT is highly sensitive for:
- Quantitative and qualitative analysis (central retinal thickness [CRT], macular volume [MV], size and number of cystic spaces, DRIL, photoreceptor layer integrity)
- Evaluating treatment response
- Detecting minimal residual cysts
- Predicting visual acuity outcomes
Typical OCT Findings in RVO:
- Diffuse retinal thickening
- Cystoid macular edema (localized cysts deforming normal retinal architecture)
- Serous neurosensory detachment (indicative of blood-retinal barrier breakdown)
- Disruption of EZ and ELM (photoreceptor involvement, critical for final visual acuity)
These capabilities make OCT an integral part of modern RVO monitoring.

4. Top 3 Challenges in RVO OCT Analysis
Despite its power, OCT assessment of RVO has significant limitations:
- Need for normative comparison
Interpretation requires comparison with the patient’s contralateral eye or established normal values. Systemic vascular anomalies can affect both eyes, limiting standardization. - Complexity with comorbidities
Many RVO patients have systemic (hypertension, diabetes) or ophthalmic comorbidities (diabetic retinopathy, AMD, glaucoma, epiretinal membrane), complicating interpretation. It can be difficult to distinguish RVO-related changes from combined pathology. - Requirement to consider the clinical context
OCT provides only part of the clinical picture. Accurate interpretation requires integration of symptoms, medical history, systemic factors, fundoscopic findings, and other diagnostic tests. Anatomical variations, comorbidities (glaucoma, cataract), and individual treatment response also necessitate a personalized approach.
5. Treatment of RVO: Modern Approaches
Currently, no treatment restores normal retinal venous circulation. Therefore, therapy focuses on controlling complications, primarily macular edema and preventing neovascularization (retinal, iris/optic disc, neovascular glaucoma, hemorrhages, and tractional changes).
All RVO patients should receive systemic management, ideally in collaboration between an ophthalmologist and a cardiologist or internist. Monitoring of blood pressure, lipids, glucose, and coagulation factors is essential, as RVO often signals systemic vascular risk.
Treatment decisions must be individualized, considering:
- RVO subtype (CRVO vs. BRVO)
- Edema severity
- Clinical and OCT findings
- Risk of adverse effects
- Patient status (comorbidities, ability for regular follow-up)
Anti-VEGF Therapy as First-Line Treatment
Intravitreal anti-VEGF injections are the first-line therapy for macular edema associated with RVO. These drugs reduce vascular endothelial growth factor (VEGF) expression, lowering vascular permeability, fluid leakage, edema, and inhibiting pathological neovascularization.
Commonly used agents:
- Ranibizumab, Aflibercept, Faricimab: proven safe and effective for CRVO and BRVO-related macular edema brvo vs crvo oct; studies show significant improvements in best-corrected visual acuity (BCVA) and central macular thickness (CMT).
- Bevacizumab: used off-label for macular edema and neovascularization.
Long-term studies indicate anti-VEGF therapy provides sustained visual improvement for many patients, with injection frequency often decreasing over time.
Advantages:
- High efficacy for macular edema
- Good tolerability and safety (systemic complications are rare)
- Personalized treatment possible
Limitations / Challenges:
- Some patients respond insufficiently
- Requires frequent injections (clinic visits, financial burden, potential complications, patient discomfort)
- Chronic or refractory edema may require alternative or combination approaches
Steroid Implants and Injections: Second-Line Therapy
Dexamethasone intravitreal implant (OZURDEX) is approved for RVO-related macular edema, particularly when:
- Anti-VEGF therapy is insufficient
- Frequent injections are impractical (distance, transportation, cost)
Steroids reduce inflammation, vascular permeability, and fluid accumulation, useful in chronic or resistant edema.
Risks / Limitations:
- Cataract (especially with repeated or long-term use)
- Increased intraocular pressure (IOP), potential steroid-induced glaucoma
Laser Therapy
- Panretinal photocoagulation is effective for neovascularization.
- Its use has declined with anti-VEGF availability, which offers strong anatomical and functional results.
Surgical Approaches
- Vitrectomy may be considered in selected cases.
- Surgery carries risks and is reserved for situations where other treatments fail or are inappropriate.
Combination Strategies
- In practice, clinicians often combine anti-VEGF therapy with steroid implants or laser treatment, depending on disease course.
- This can reduce total injection burden, minimize side effects, and improve outcomes in chronic or recurrent edema.
Monitoring Frequency
- Active macular edema or ongoing treatment requires regular OCT follow-up to evaluate therapeutic response and adjust injection intervals.
- OCT schedule:
- Monthly at treatment initiation
- Individualized intervals using Treat-and-Extend protocols
- Structural monitoring to prevent atrophic changes
- Ischemic RVO patients have the highest neovascularization risk within the first 90 days; monthly monitoring during the first 6 months is critical.
Conclusions and Recommendations
RVO is a complex, multifactorial vascular disorder that can cause sudden and severe vision loss, particularly in patients with systemic risk factors. Modern management aims not only to address acute complications but also to control long-term structural retinal changes.
OCT has transformed RVO care by providing:
- Early detection of edema, subclinical ischemia, and architectural changes
- Dynamic monitoring of treatment response, allowing timely adjustments and optimization
- Improved long-term prognostication through evaluation of macular thickness, outer retinal layers, and fluid volume
OCT helps identify edema type and secondary changes—atrophy, photoreceptor damage, inner retinal thinning—allowing a more accurate visual prognosis, especially in ischemic RVO.
When combined with modern anti-VEGF agents, long-acting steroid implants, and personalized dosing regimens, OCT enables:
- Reduction of unnecessary injections via interval optimization
- Maximized treatment efficacy based on morphological findings
- Prevention of recurrence and progression through early detection of edema
Thus, OCT is not merely a visualization tool but a core element of clinical decision-making, improving patient management, preventing complications, and enabling more complete and stable visual recovery.
Clinical Recommendation: Integrate regular OCT assessments into RVO management, with attention to macular thickness dynamics and outer retinal layer integrity for precise disease control and optimized therapeutic outcomes.
References:
- https://pubmed.ncbi.nlm.nih.gov/38714470/
- https://www.rcophth.ac.uk/wp-content/uploads/2015/07/Retinal-Vein-Occlusion-Guidelines-Executive-Summary-2022.pdf
- https://www.mdpi.com/2077-0383/14/4/1183
- https://www.auctoresonline.org/article/clinical-therapeutic-orientation-in-retinal-venous-obstruction
- https://www.mdpi.com/2077-0383/10/3/405
- https://pmc.ncbi.nlm.nih.gov/articles/PMC10801953
- https://www.mdpi.com/2075-4418/13/19/3100
- https://karger.com/oph/article-abstract/242/1/8/255831/Microvascular-Retinal-and-Choroidal-Changes-in?redirectedFrom=fulltext
- https://link.springer.com/article/10.1007/s40123-024-01077-9
- https://pubmed.ncbi.nlm.nih.gov/39717563/
- https://provider-rvo.vision-relief.com/introduction/management/
-
Key Trends in Ophthalmology and Optometry in 2026
Maria Znamenska
3 min.Introduction
The year 2026 in ophthalmology will not be defined by a single “major breakthrough,” but rather by key trends in Ophthalmology and optometry in 2026, and the maturation of several directions whose discoveries and innovations are now transitioning into everyday clinical practice. While just a few years ago innovations were often perceived as isolated technologies far removed from real-world care (a new drug, device, or piece of equipment), today entire ecosystems are being formed: from early detection to long-term monitoring, from the ophthalmologist’s office to optometric screening, from a single consultation to a longitudinal patient journey supported by digital tools.
The core logic of 2026 is a shift from reactive to proactive ophthalmology. Increasingly, the goal is to prevent disease at the stage of risk-factor modification, intervene in the earliest pathological changes, and track preclinical markers. This shift is visible across several dimensions: the growing role of telemedicine and portable diagnostics; autonomous AI becoming a public health tool; and oculomics, which enables ocular image analysis to serve as a source of early biomarkers for systemic conditions. At the same time, the treatment paradigm is evolving: where repeated procedures once dominated (for example, frequent intravitreal injections), 2026 brings a move toward extended-duration regimens, implant-based drug delivery platforms, and disease control with fewer clinic visits.
Another important axis is the alignment of patient expectations. Some new approaches (for example, in the management of dry AMD and geographic atrophy) do not promise to “restore vision,” but rather to buy time—slowing structural retinal damage and functional vision loss. As a result, in 2026, risk–benefit communication and shared decision-making become almost as important as the choice of molecule or device itself.
Below, we outline the key eye care trends of 2026: what is changing, why it matters, and how it will shape ophthalmic and optometric practice.
1. New Approaches to Treatment
1.1. Geographic Atrophy (GA): The Introduction of Active Treatment in eye care trends 2026
1.1.1. Injectable Therapies as Ophthalmology Trends 2026
Following the key trends in Ophthalmology and Optometry in 2026 , development of injectable therapies for geographic atrophy, clinical practice is entering a “second wave” phase—where the main questions are no longer whether therapy is possible for a disease historically considered untreatable, but how that therapy should be practically implemented. In 2026, the focus will be on patient selection, treatment initiation, dosing frequency and duration, as well as monitoring.
Currently, the FDA has approved the following injectable therapies for GA:
- Izervay (avacincaptad pegol) — a C5 complement inhibitor.
- Syfovre (pegcetacoplan) — a C3 complement inhibitor.
Their mechanism of action involves reducing chronic inflammation and cellular damage in the retina and—most importantly—slowing the rate of GA lesion expansion.
Because most available data focus on slowing atrophy progression (an anatomical endpoint) rather than guaranteed improvements in visual acuity, properly managing patient expectations becomes particularly critical in 2026. Clear discussions about therapeutic goals and limitations are emphasized in review publications addressing the first approved GA treatments.
1.1.2. Multiwavelength Photobiomodulation
Multiwavelength photobiomodulation is one of the most promising emerging approaches and key trends in Ophthalmology and Optometry in 2026 aimed at halting or slowing the progression of dry AMD through modulation of mitochondrial activity. The use of specific wavelengths (red and near-infrared light, approximately 590–850 nm) may reduce oxidative stress in retinal cells, inflammation, and apoptosis of retinal pigment epithelium cells.
Its appeal is clear: a non-invasive procedure with significantly better acceptability for some patients compared with regular injections.
Until recently, its effectiveness remained debated, with studies showing only temporary functional improvement and reduction in drusen volume. At ARVO 2025, updated results from the LIGHTSITE III study demonstrated that photobiomodulation can significantly slow visual acuity decline and reduce the rate of GA expansion.
In 2025, the FDA approved photobiomodulation for AMD, creating strong prospects for broader clinical adoption in 2026.
The 2026 trend is correct positioning and stratification:
- Use of photobiomodulation based on clear indications for specific dry AMD stages and patient profiles.
- Transparent communication of expectations, with goals focused on functional support and slowing GA progression rather than guaranteed vision restoration.
1.2. Extended Anti-VEGF Treatment Regimens
Another major trend is the shift toward regimens with reduced injection frequency. This is not merely about comfort, but primarily about preventing missed visits: patients with AMD and diabetic retinopathy with DME often fall out of treatment due to visit burden. Thus, 2026 reinforces the principle that treatment must be effective in real-world conditions, not only under ideal adherence.
The ranibizumab port delivery system (Susvimo, Port Delivery System) has become emblematic of this trend. In 2025, the FDA also approved Susvimo for the treatment of diabetic retinopathy.
1.3. Gene Therapy for Macular Telangiectasia Type 2 (MacTel 2)
MacTel 2 is a chronic, progressive neurodegenerative retinal disease that previously lacked active treatment.
In 2025, the first implantation of ENCELTO (revakinagene taroretcel)—the first and currently only FDA-approved gene therapy for MacTel 2—was performed in the United States. ENCELTO enables a shift from observation to active intervention, with the potential to preserve visual function in early-stage patients.
The device is based on encapsulated cell therapy technology: a capsule containing genetically modified cells that continuously secrete recombinant human ciliary neurotrophic factor (CNTF), acting as a neuroprotective agent that slows photoreceptor degeneration.
In 2026, the focus will move from “innovation storytelling” to routine clinical implementation, including defining early selection criteria, monitoring protocols (OCT biomarkers, functional testing), and accumulating real-world long-term data on photoreceptor preservation and visual function.
1.4. Gene Therapy for Neovascular AMD: Closest to Real Transformation
For neovascular AMD, gene therapy remains one of the most anticipated eye care trends 2026 directions, as it has the potential to fundamentally change treatment logic—from repeated injections to a single vector administration enabling long-term therapeutic protein expression. Reviews published in 2025 highlight active programs such as RGX-314, ADVM-022 (Ixo-vec), 4D-150, and others.
In 2026, the key questions shift from “does it work?” to “how does it work across different patient groups?” including:
- Stability and duration of expression;
- Inflammatory and immune response profiles;
- Need for supplemental anti-VEGF therapy;
- Patient selection criteria;
Injection centers and post-procedure monitoring standards.
2. Oculomics: The Eye as a “Window to the Body” and a Source of Digital Biomarkers
Oculomics is one of the most compelling trends of 2026, as it reshapes ophthalmology’s role within medicine as a whole. The concept is simple: the eye is the only structure where microvasculature, neurons, and signs of metabolic and inflammatory processes can be visualized non-invasively at high resolution. As a result, fundus and OCT/OCTA data may serve as biomarkers for systemic conditions—from cardiovascular risk to neurodegenerative diseases.
In contemporary research, oculomics is described as an approach that uses retinal images to assess systemic risks and conditions, with potential scalability for screening. In 2026, this “scale” becomes critical: data may originate not only from ophthalmology clinics, but also from optometric practices, mobile screening programs, and telemedicine.
What truly changes in 2026:
- A transition from “interesting correlations” to clinical utility, with models expected to demonstrate actionable impact on patient management.
- Data verification and management of false-positive risk, including the communication of systemic risk to patients.
- Integration with AI, as multidimensional patterns often exceed human interpretive capacity.
A major risk in 2026 is over-marketing, reinforcing the need for externally validated models with clear clinical context that do not generate unnecessary “medical noise.”
3. AI Technologies: From Decision Support to Autonomous Screening and Managed Patient Pathways
3.1. Autonomous Diabetic Retinopathy Screening as a Scalable Standard
In 2026, diabetic retinopathy remains the most studied use case for autonomous AI. In the United States, three FDA-approved autonomous DR screening systems are already described (LumineticsCore/IDx-DR, EyeArt, AEYE-DS). This positions AI as a practical tool capable of influencing large-scale screening programs, particularly in primary care, endocrinology clinics, and mobile settings.
The FDA approval of AEYE-DS as a fully autonomous solution (portable camera plus algorithm) underscores that in 2026, AI increasingly “works where the patient is,” not only where an ophthalmologist is present.
3.2. 2026 as the Year of Integration
Successful projects in 2026 will be distinguished by:
- Image quality standards and quality control;
- Clear referral rules and urgency levels;
- Mechanisms to ensure patient follow-through (scheduling, reminders, visit tracking);
- Transparent documentation for clinicians, patients, and audit purposes.
3.3. AI as “Invisible Infrastructure”
In 2026, AI increasingly functions as invisible infrastructure: highlighting high-risk cases, prioritizing queues, generating structured reports, and standardizing interpretation. The impact is reduced variability, faster routing, and fewer missed cases.
4. Telemedicine: From Video Calls to Retinal Screening and Remote Management
By 2026, telemedicine in ophthalmology is no longer synonymous with video consultations. Its foundation is tele-imaging: transmission and assessment of retinal images (fundus photos, sometimes OCT) with structured referral protocols.
At the same time, limitations become more openly discussed. Certain conditions and components of assessment may be less accurately captured remotely, requiring clear protocols to define which patients can be managed remotely and which require in-person examination.
The 2026 trend is a shift from “tool” to “pathway”:
- Tele-screening as the first step;
- Automated or semi-automated reporting;
- Referral and follow-up control;
Remote reassessment for ongoing risk monitoring.
5. New Devices and Portable Diagnostics: Closer, Faster, More Scalable Care
5.1. Portable Diagnostics as the Foundation of Coverage
Portable fundus cameras and compact diagnostic systems represent one of the most practical changes of 2026. Their value lies not only in technology, but in enabling large-scale screening in locations without full ophthalmic infrastructure.
Synergy with autonomous AI (such as AEYE-DS) is especially strong here, supporting new partnership models:
- Endocrinology and primary care clinics;
- Optical stores and optometric practices;
- Mobile programs for workplaces or regions.
5.2. Devices Deliver Value Only with Quality Protocols
Success depends not just on acquiring devices, but on defined protocols:
- Staff training in image acquisition;
- Minimum quality criteria;
- Retake rules;
- Handling ungradable cases.
In 2026, image quality becomes decisive, as AI and telemedicine depend on it.
5.3. Home and Remote Monitoring for Extended Treatment Regimens as eye care trends 2026
As treatment intervals lengthen, the risk of between-visit deterioration increases. Thus, 2026 strengthens the role of:
- Home functional monitoring;
- Digital questionnaires and symptom trackers;
Remote checkpoints signaling the need for earlier recall.
6. 2026 as the Year of Standardized Myopia Control and Greater Risk Awareness
By 2026, myopia control is no longer debated but formalized, grounded in consensus documents and systematic reviews. Myopia is increasingly recognized as a chronic disease with stages, phenotypes, and potentially blinding complications.
Implications for practice:
- Focus on preventing progression to high myopia.
- Combined strategies integrating behavioral, optical, and pharmacologic interventions with monitoring.
- A shared language between optometrists and ophthalmologists, with coordinated patient pathways.
- Support from AI and telemedicine for risk detection and personalized care.
Myopia control in 2026 becomes a structured, long-term risk-reduction process.
7. Optogenetics: Expanding the Evidence Horizon in Inherited Retinal Degenerations
In 2026, optogenetics moves beyond concept into longer-term observation. Publications from 2025 highlight functional stabilization or improvement in retinitis pigmentosa, emphasizing pragmatic success criteria.
For patients with severe vision loss, meaningful outcomes extend beyond visual acuity charts to spatial orientation, object recognition, and contrast sensitivity. In 2026, discussions increasingly focus on realistic endpoints and honest communication of limitations.
8. Less Invasive Interventions and Patient Comfort as Components of Clinical Effectiveness
Another key eye care trends 2026 is less traumatic technology that preserves efficacy while improving patient experience. A notable example is the FDA approval of Epioxa (epi-on) for keratoconus in 2025, preserving corneal epithelium and potentially reducing pain and recovery time.
This trend spans refractive surgery, ocular surface disease, and chronic condition management, reinforcing that patient experience is integral to adherence and clinical outcomes.
Conclusion
The ophthalmology trends 2026 clearly demonstrate that ophthalmology and optometry are entering a phase of mature transformation, where success is driven not by isolated innovations but by their integration into coherent clinical pathways. The focus is shifting from treating consequences to early detection, slowing progression, and long-term management of chronic eye disease.
Active treatment of geographic atrophy, photobiomodulation, extended anti-VEGF regimens, and the emergence of gene therapies for MacTel 2 and neovascular AMD fundamentally reshape patient management—from observation or frequent procedures to strategies aimed at preserving retinal structure and function with minimal procedural burden. These approaches require careful patient stratification and responsible expectation management, as the goal increasingly becomes slowing neurodegeneration rather than restoring vision.
At the diagnostic level, 2026 reinforces decentralization: portable devices, telemedicine, and autonomous AI bring screening closer to patients and enable coverage of much broader populations. Oculomics and AI transform ocular images into sources of digital biomarkers that may influence not only ophthalmic but also general clinical management. At the same time, it becomes clear that technological value is defined not by algorithms or devices, but by data quality, model validation, and clearly structured patient pathways—from screening to treatment.
-
Diabetic Retinopathy Screening and Treatment: a Complete Guide
Maria Znamenska
5 minDiabetic retinopathy screening and treatment: a complete guide
Table of Contents
- What are the diabetic retinopathy screening methods?
- Fundus images in DR screening
- Can OCT detect diabetic retinopathy?
- What does diabetic retinopathy look like on OCT?
- What is optimal diabetic retinopathy screening frequency?
- What is the best treatment for diabetic retinopathy?
- Diabetic retinopathy management: key takeaways
Diabetic retinopathy (DR) remains the leading cause of irreversible vision loss among working-age adults worldwide. According to the International Diabetes Federation (IDF), one in three patients with diabetes shows signs of DR, and 10% develop diabetic macular edema (DME). Early diagnosis, systematic screening, and individualized monitoring are essential to prevent vision loss.
What are the diabetic retinopathy screening methods?
Modern methods of DR screening include:
- Telemedicine platforms – enable automated transmission of fundus images
- Mobile fundus cameras – Wi-Fi–enabled devices for field examinations
- Smartphone-based platforms – use specialized lenses for retinal imaging
- Optical coherence tomography (OCT) – used to detect early retinal changes and diabetic macular edema, complementing fundus photography
- AI-based systems – solutions for automated image analysis for fundus and OCT
In practice, these methods are often combined. For example, patients may undergo fundus photography, after which images are sent to telemedicine centres and analysed by AI algorithms. More complex cases are then referred to ophthalmologists.
DR screening is frequently incorporated into annual diabetes check-ups conducted by primary care physicians trained in basic fundus photography. This approach, already successfully implemented in several EU countries, has reduced the incidence of severe DR.
Innovations in DR screening have broadened access for rural residents, older adults, and individuals with limited mobility. Integration into national e-health systems enables automated reminders and electronic medical record linkage, incorporating laboratory data (HbA1c, blood pressure) alongside retinal images.
Fundus images in DR screening
Fundus photography is the optimal primary screening method due to its high diagnostic yield, cost-efficiency, simplicity, and ability to integrate with AI and telemedicine solutions.
It enables detection of microaneurysms, hemorrhages, exudates, and neovascularization, often before symptoms arise. National screening programs rely heavily on digital fundus imaging, which, when combined with AI, provides an efficient platform for mass DR detection.
Advances in fundus imaging for diabetic retinopathy have improved efficiency. Modern non-mydriatic cameras deliver high-quality images without pupil dilation, while automated image analysis supports rapid identification of suspicious cases. Cloud storage and telemedicine platforms facilitate remote evaluation, increasing coverage in regions with limited ophthalmology services.
Next-generation wide-field cameras further enhance detection by capturing peripheral pathology. Some devices also generate automated annotations, reporting lesion type, DR stage, and DME presence, thereby standardizing interpretation and expediting clinical decision-making.

Diabetic retinopathy detection from fundus images Can OCT detect diabetic retinopathy?
Yes. OCT can detect early structural changes in the retina and is increasingly used to complement standard diabetic retinopathy screening.
- Role in DR screening – While not a primary screening tool, OCT is now widely applied alongside fundus photography. It is especially valuable for detecting early diabetic macular edema (DME) and subtle morphological changes in the central retina not visible during ophthalmoscopy.
- High-resolution imaging – OCT visualizes changes such as photoreceptor layer disruption, subclinical intraretinal fluid, neurosensory retinal thickening, and foveal edema. These findings often appear before clinically significant macular edema.
- Differential diagnosis – OCT also helps identify other causes of vision loss in diabetic patients, for example, ruling out age-related macular degeneration.
- Clinical evidence – Studies confirm that combining OCT with fundus photography increases diagnostic accuracy for DME. Experts therefore recommend this approach for patients with long-standing diabetes, poor glycemic control, or vision complaints.
What does diabetic retinopathy look like on OCT?
On OCT, diabetic retinopathy (DR) can appear as a combination of retinal structural damage, fluid accumulation, and microvascular changes that may not be visible on fundus photography.
Typical OCT findings in DR include:
- Photoreceptor damage – loss of outer retinal layers, especially the ellipsoid zone
- Intraretinal hyperreflective foci, hard exudates
- Microaneurysms – visible as small, round changes within the retina
- Retinal thickness changes and neuroepithelial layer atrophy
- Diabetic macular edema – with intraretinal hyporeflective cystoid spaces and neuroepithelial swelling
- Subretinal fluid – resulting from increased vascular permeability
- DRIL – disorganization of inner retinal layers, associated with poor prognosis
- Epiretinal membranes – potential precursors to retinal detachment
Advanced findings
OCT can also reveal proliferative changes and tractional zones, which may progress to tractional retinal detachment.OCTA insights
Beyond structural analysis, OCT angiography (OCTA) allows visualization of retinal microvascular changes without the contrast injection. OCTA helps identify areas of neovascularization, capillary network disruption, and the degree of macular ischemia.Diabetic retinopathy (hyperreflective foci, moderate destruction of the ellipsoid zone and RPE), diabetic macular edema (neuroepithelium edema, intraretinal cystic cavities), epiretinal membrane What is optimal diabetic retinopathy screening frequency?
The screening frequency for diabetic retinopathy is tailored to diabetes type, disease stage, and risk factors:
Type 1 diabetes
- First screening: 3–5 years after diagnosis (due to onset in children and young adults)
- Then annually, if no DR is detected
- If DR is present, frequency depends on severity
Type 2 diabetes
- Screening at diagnosis, as DR may already be present.
- If no DR, repeat every 1–2 years.
Patients with confirmed DR
- No visible DR, mild non-proliferative diabetic retinopathy (NPDR), no DME — every 1–2 years
- Moderate NPDR — every 6–12 months.
- Severe NPDR — every 3 months.
- Proliferative DR (PDR) — monthly, with regular OCT monitoring of the macula.
- DME — monthly if center-involving, every 3 months if not.
Pregnant women with type 1 or type 2 diabetes
- Screening before conception or in the first trimester, with follow-up each trimester and postpartum
- Screening is not required for gestational diabetes without pre-existing diabetes
Post-treatment patients (laser or vitrectomy)
- Typically, every 3–6 months during the first year, individualized based on retinal stability
Diabetic retinopathy (hyperreflective foci, microaneurysms, destruction of the ellipsoid zone and RPE), diabetic macular edema (neuroepithelial swelling, intraretinal cystic cavities), epiretinal membrane. Monitoring of diabetic retinopathy progression
Ongoing diabetic retinopathy monitoring is essential to detect early signs of progression and guide treatment decisions. A key focus in monitoring is diabetic macular edema (DME), which represents fluid accumulation in the macula due to leakage from damaged retinal vessels. DME is a common complication of DR and the leading cause of vision loss in diabetic patients. OCT plays a central role in detecting DME and identifying structural changes that indicate disease progression.
OCT biomarkers in DME
OCT enables precise visualization of retinal layers with micron resolution, confirming DME presence and providing prognostic biomarkers for treatment selection and monitoring.
The main OCT biomarkers in DME include:
- Cystoid hyporeflective intraretinal spaces – usually in the inner nuclear layer (INL) or outer plexiform layer (OPL). Their number, size, and location correlate with edema severity. Large or confluent spaces may indicate chronicity and a worse prognosis.
- Subretinal fluid – accumulation between the neurosensory retina and retinal pigment epithelium. Often associated with a better visual prognosis, but requires close monitoring and consideration in anti-VEGF therapy.
- Central macular thickening – a key marker of treatment effectiveness and disease activity.
Diabetic retinopathy (hyperreflective foci, hard exudates), diabetic macular edema (neuroepithelial swelling, intraretinal cystic cavities). OCT red flags in DR progression
Beyond DME, OCT helps identify broader signs of DR worsening that require therapy reassessment:
- Progressive central macular thickening despite treatment
- Increase in intraretinal or subretinal fluid, or enlargement of cystoid spaces
- New hyperreflective foci, reflecting inflammatory activity (these may precede hard exudates or RPE changes)
- Development or progression of disorganization of inner retinal layers (DRIL), an independent predictor of poor prognosis, even when orphological improvement is seen on OCT
- Ellipsoid zone disruption, indicating photoreceptor damage
- Signs of macular ischemia, although better evaluated with OCTA, indirect signs on OCT may include thinning of the inner retinal layers.
- Tractional changes, such as epiretinal membranes, inner retinal stretching, or macular traction
Diabetic retinopathy (hyperreflective foci, hard exudates, destruction of the ellipsoid zone and RPE, disorganisation of the retinal inner layers (DRIL)), Diabetic macular edema (neuroepithelial swelling, intraretinal cystic cavities), subretinal fluid. The appearance of these OCT features should prompt clinicians to reconsider therapy, whether by switching anti-VEGF agents, introducing steroids, using combination therapy, or referring patients for surgical evaluation when traction is present.
Diabetic retinopathy (hyperreflective foci, hard exudates, destruction of the RPE), Diabetic macular edema (neuroepithelial swelling, intraretinal cystic cavities), subretinal fluid. What is the best treatment for diabetic retinopathy?
The treatment of diabetic retinopathy is based on a comprehensive approach that takes into account not only the disease stage, but also individual patient characteristics, OCT findings, comorbidities, and prognostic biomarkers. Modern strategies combine preventive, pharmacological, and surgical methods, as well as personalized medicine tools based on retinal imaging.
Criteria for treatment selection
The choice of therapy is guided by the following parameters:
- DR stage – non-proliferative, proliferative, with or without DME
- Form of macular edema – focal, diffuse, with or without subretinal fluid
- Presence of DRIL, EZ disruption, ischemic changes on OCTA
- Response to previous treatment – anti-VEGF, steroids, laser
- Comorbidities – renal insufficiency, hypertension, poor adherence
For low-risk patients, observation or focal laser may be sufficient. Patients with significant DME usually require anti-VEGF or steroid injections. Those with proliferative DR often undergo panretinal laser photocoagulation or vitrectomy.
Diabetic retinopathy treatment methods
The main treatment options for diabetic retinopathy include pharmacotherapy, laser therapy, surgical intervention, and personalized approaches based on OCT.
1. Pharmacotherapy: anti-VEGF and steroids
Anti-VEGF agents such as aflibercept, ranibizumab, and bevacizumab are the first-line therapy for diabetic macular edema. They are especially effective in patients with pronounced edema and without ischemia.
New drugs with extended duration of effect, including port delivery systems, are becoming available.
Steroids are used when DME is persistent, when patients do not respond to anti-VEGF therapy, or in cases with an inflammatory phenotype.
2. Laser therapy
Injections have largely replaced laser therapy in the treatment of DME. However, panretinal photocoagulation remains the standard treatment for proliferative DR.
Subthreshold micropulse laser is increasingly applied for focal edema, as it minimizes tissue damage.
3. Surgical treatment
Vitrectomy is recommended in cases of tractional macular edema, vitreous hemorrhage, or retinal detachment.
4. Personalization with OCT
Modern treatment protocols use OCT biomarkers to tailor therapy and improve prognosis.
Patient education and multidisciplinary care
DR treatment outcomes strongly depend on adherence. Patients must be informed about the need for regular injections, monitoring, and systemic control. Coordinated care involving ophthalmologists, endocrinologists, and family doctors helps maintain stable glycemic control and slows DR progression.
Diabetic retinopathy management: key takeaways
Diabetic retinopathy is a progressive disease, but modern diagnostics and treatments make it possible to preserve vision and improve outcomes. OCT and OCTA have become essential tools for early detection, risk assessment, and personalized therapy planning. Effective management combines pharmacotherapy, laser treatment, surgery, and patient education. Multidisciplinary care and strong patient adherence remain crucial for long-term success. With timely monitoring and tailored treatment, the progression of diabetic retinopathy can be significantly slowed.
Disclaimer: USA FDA 510(k) Class II; Altris Image Management System (Altris IMS); AI/ML models and components intended to use for research purposes only, not for clinical diagnosis purposes.


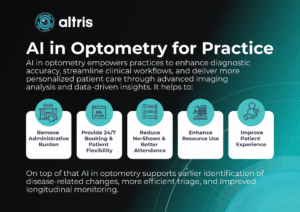


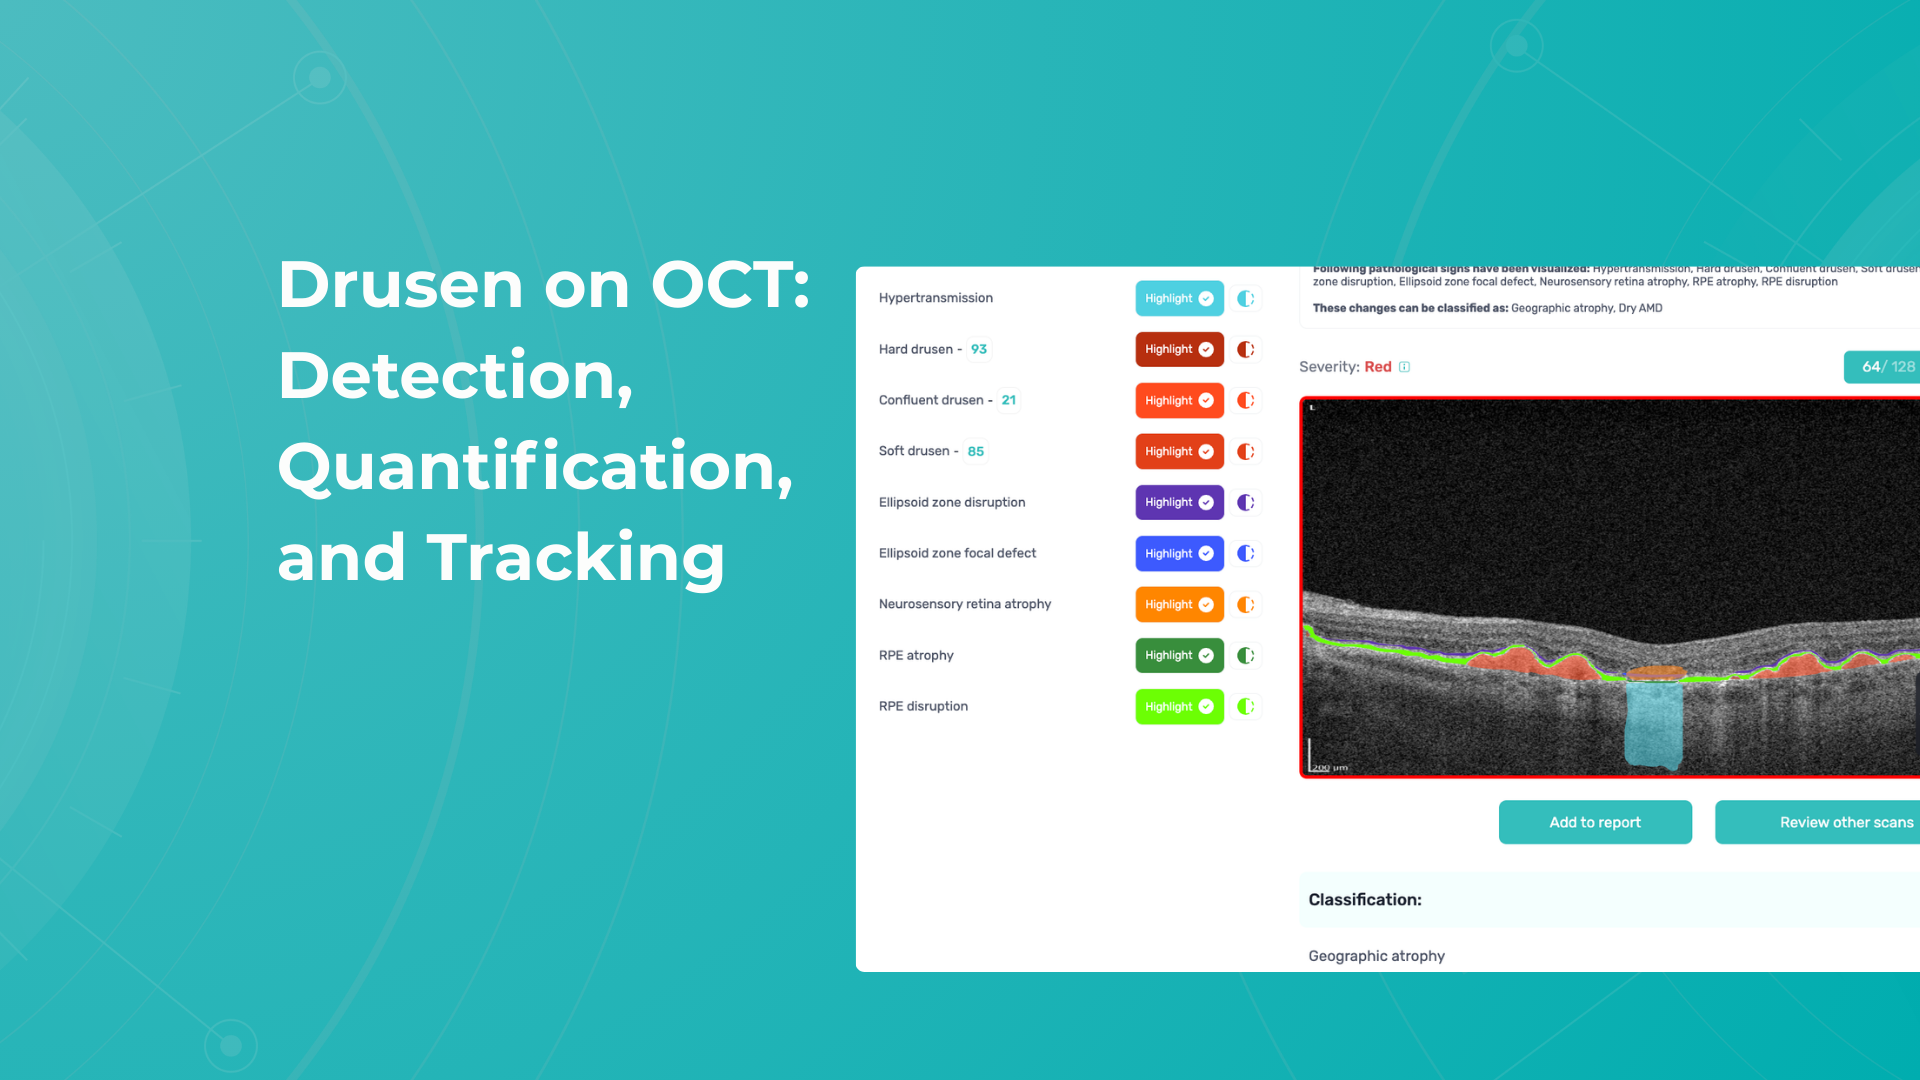


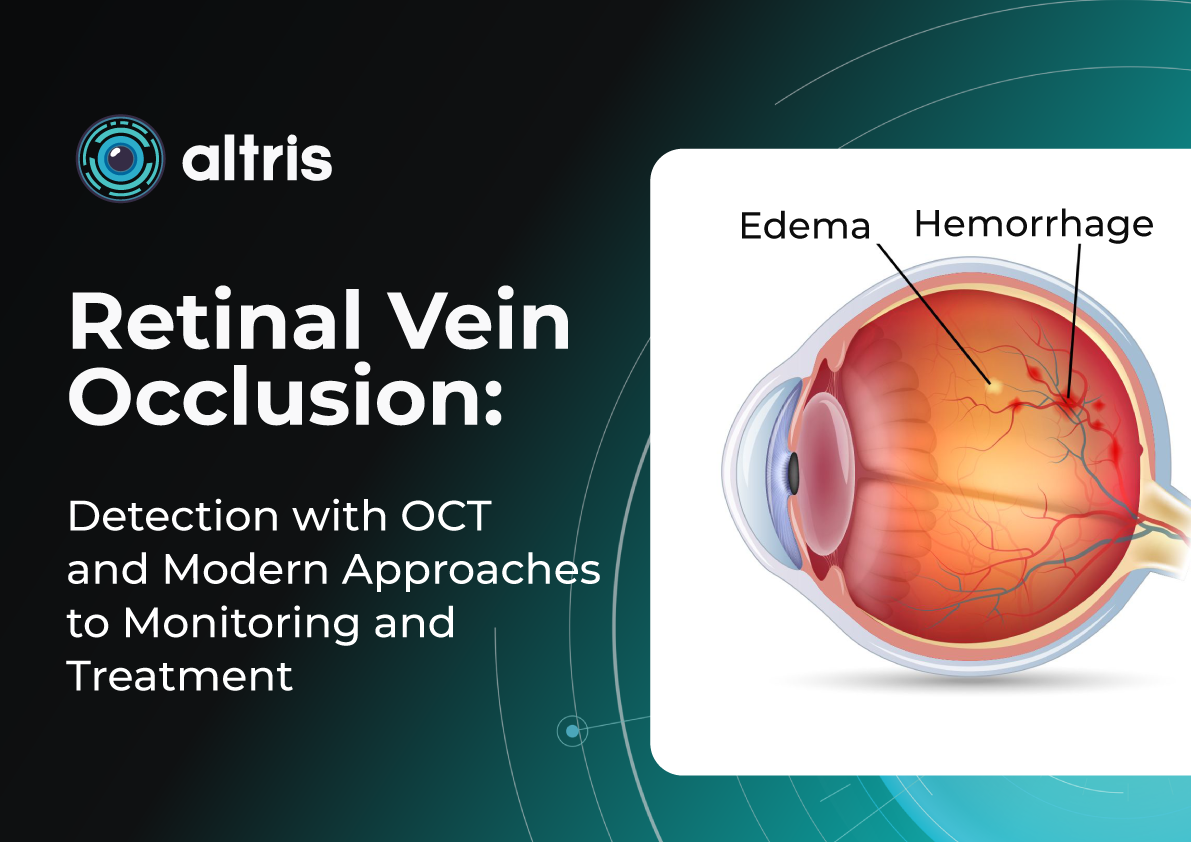
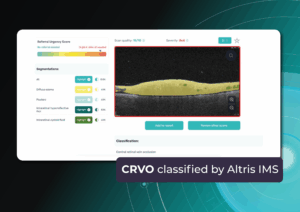
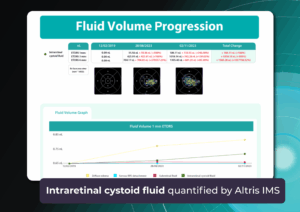
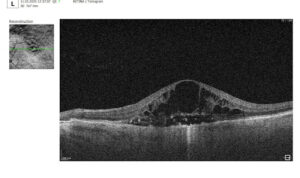
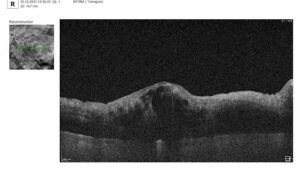
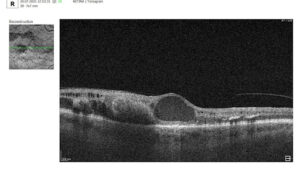
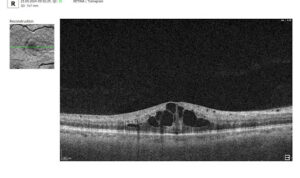
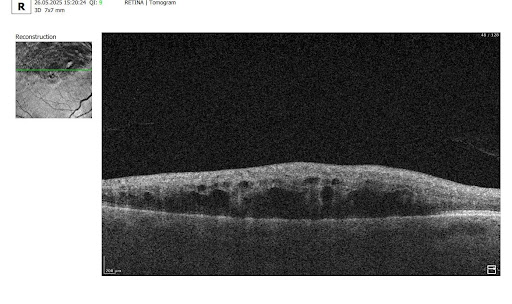


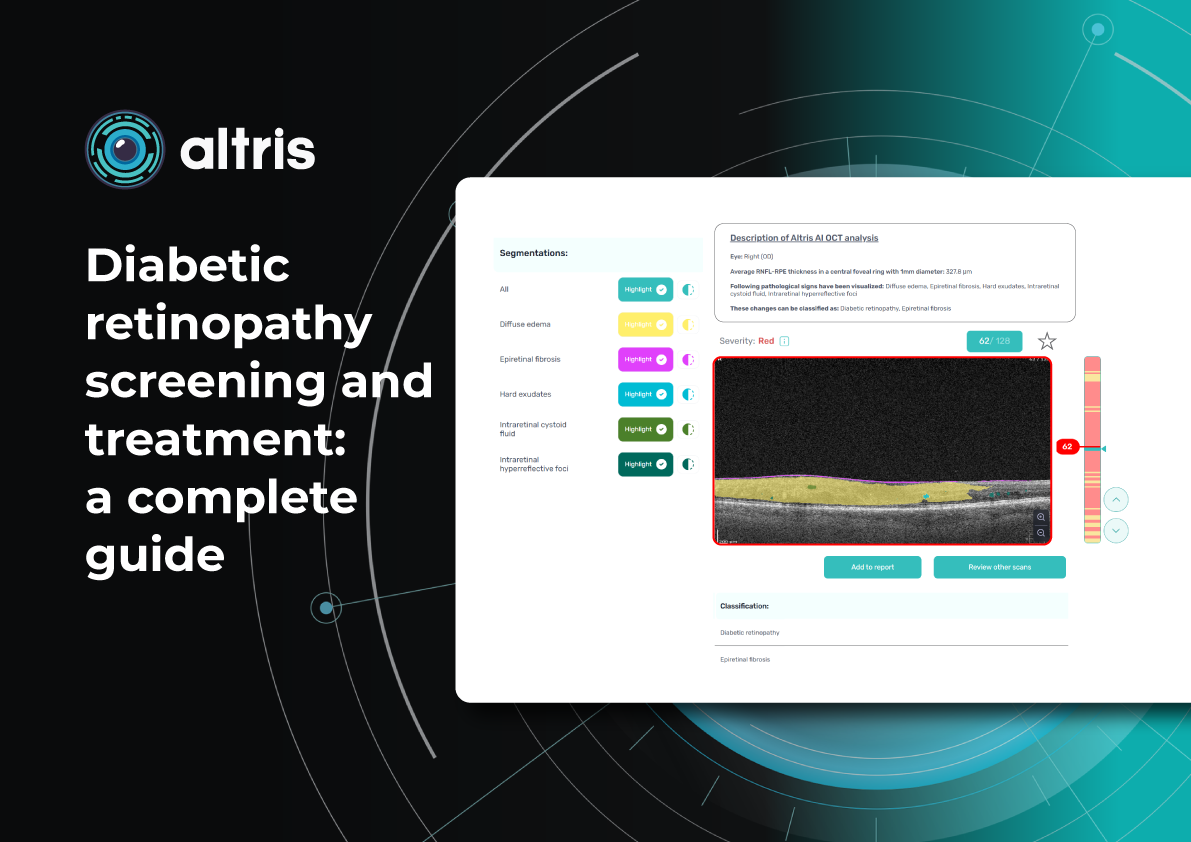

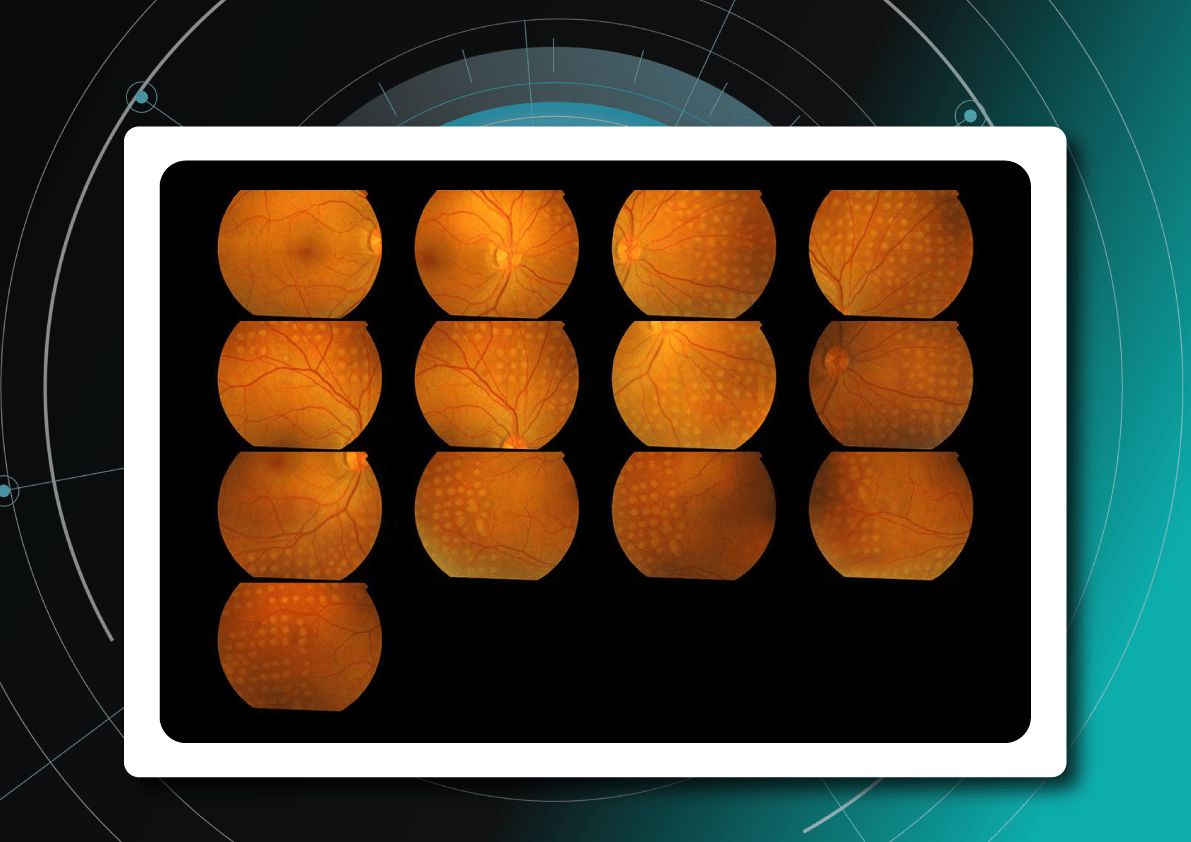
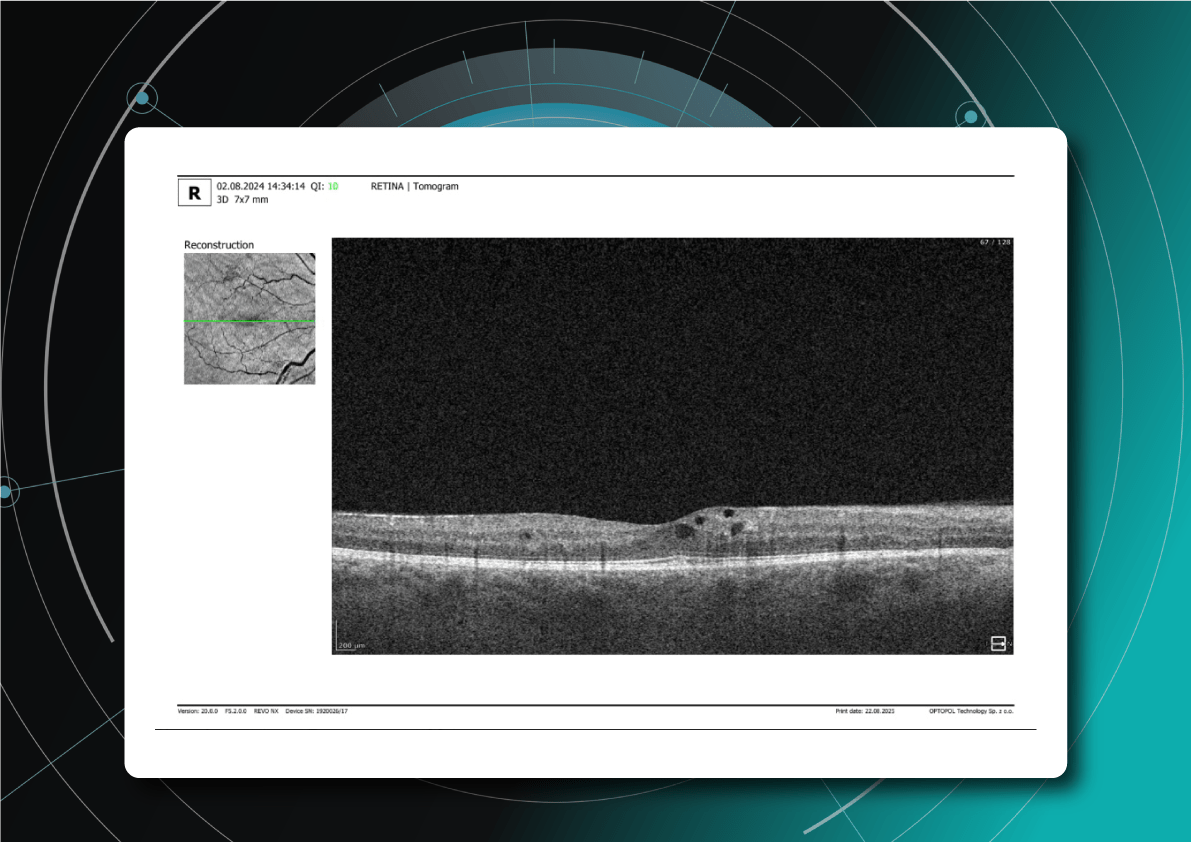
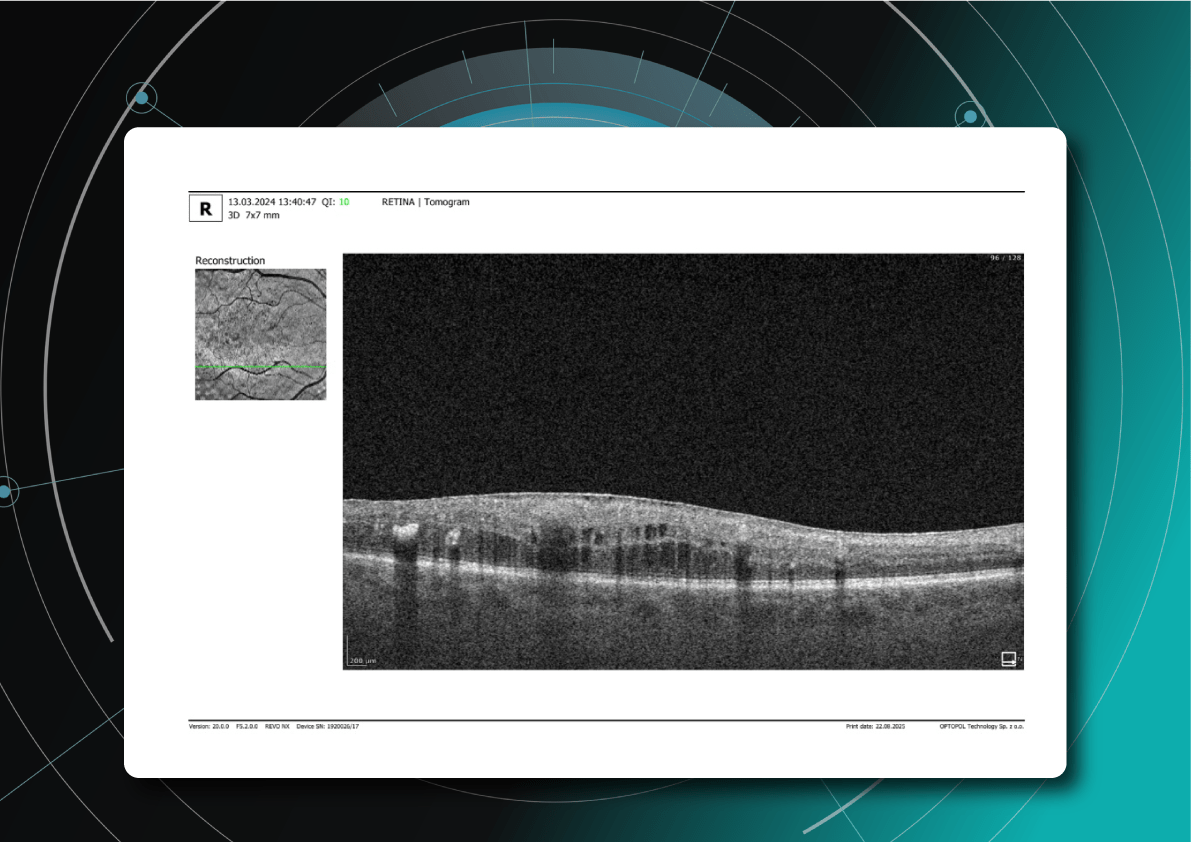
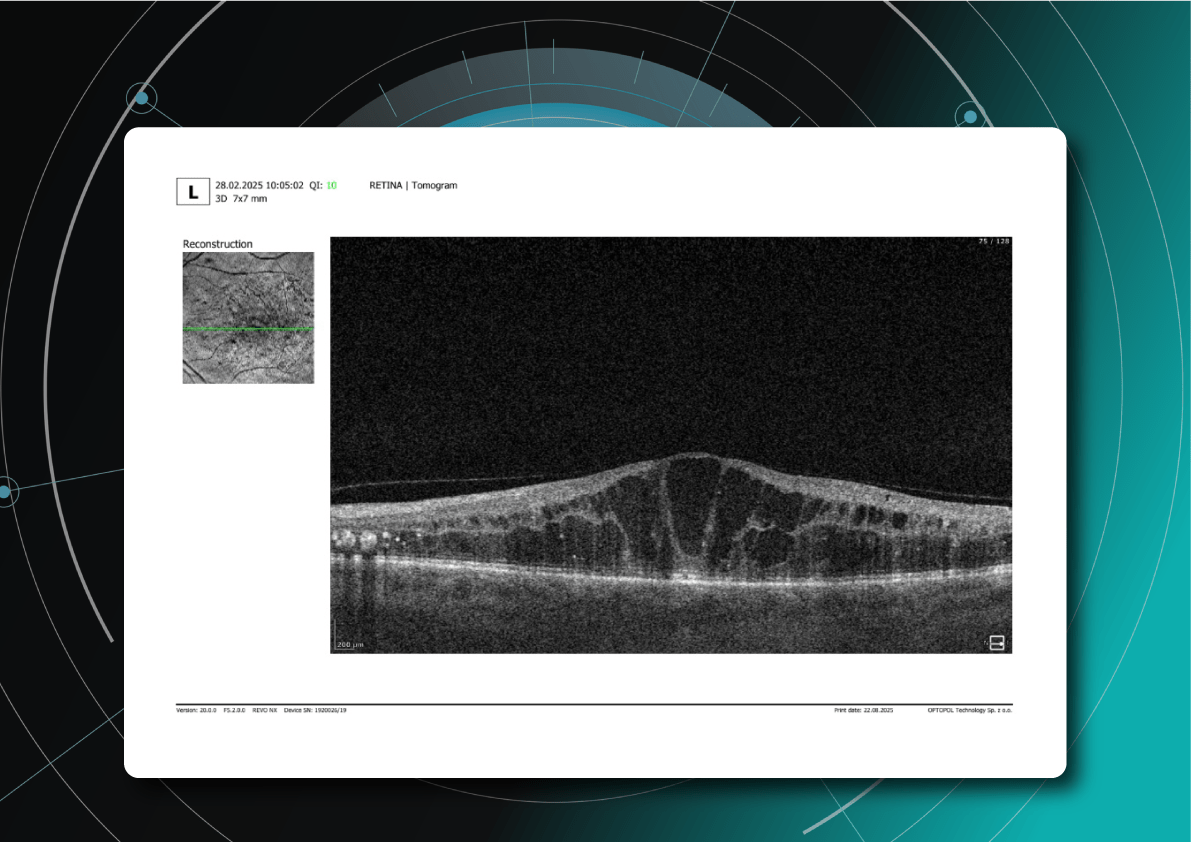
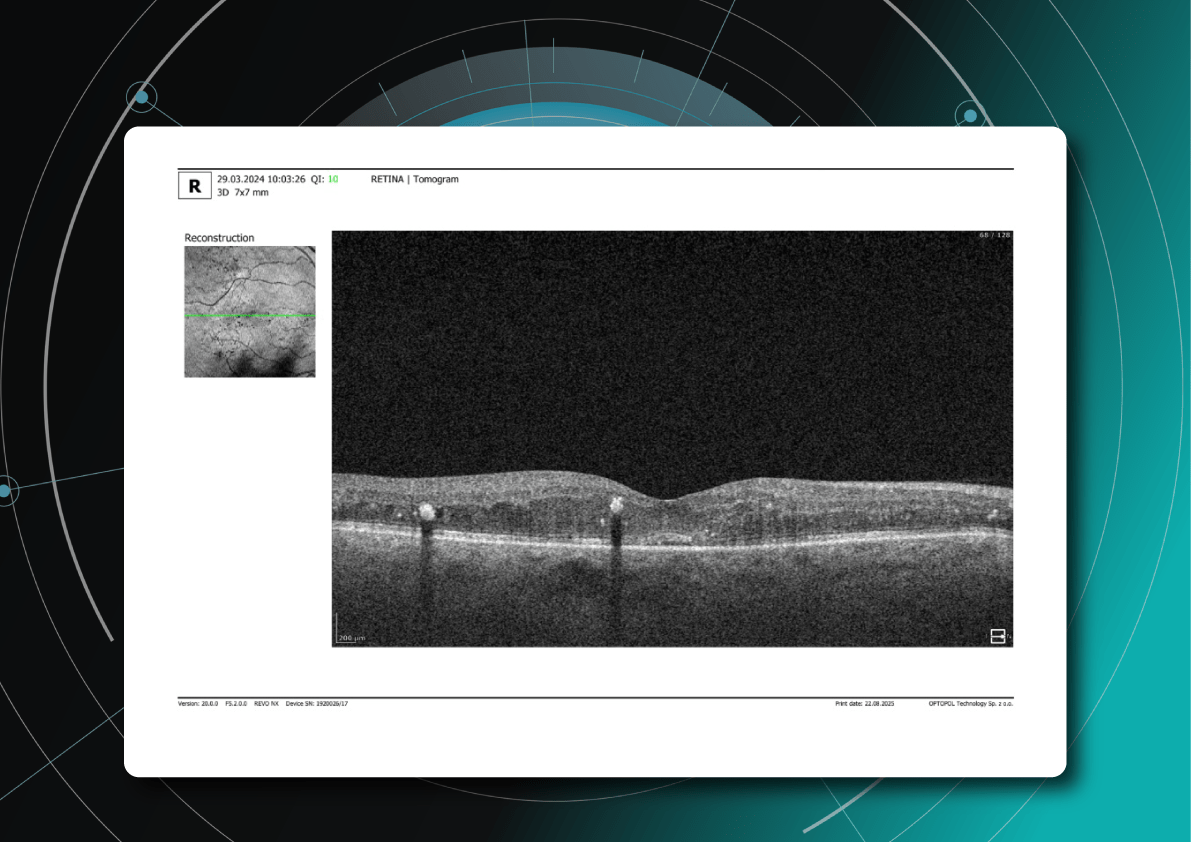
Recently Posted
-
Drusen on OCT: Detection, quantification, and tracking
Maria Znamenska
5 min.Introduction
Drusen remains one of the main biomarkers of age-related macular degeneration (AMD). They play a prognostic role and reflect the stage of the disease. Distinguishing drusen parameters provides a personalized risk profile for the transition to geographic atrophy or neovascular AMD. Everyone working with AMD patients should know how to detect, quantify, and track drusen on OCT.
What are the types of drusen?
Drusen are accumulations of pathological material of lipid-protein nature, localized under the PES. They reflect impaired transport and exchange between the retinal pigment epithelium and Bruch’s membrane. Historically, they are divided into hard, soft, reticular pseudodruses (or subretinal drusenoid deposits) and other less common types (confluent, pachidruses) as well as other retinal OCT biomarkers for drusen segmentation.
Hard drusen
On ophthalmoscopy, they are small, rounded, clearly delineated foci of yellowish-white color. On OCT, they look like local deposits of hyperreflective material under the PES with a diameter of no more than 63 microns. In small quantities (up to 8), they are not a sign of pathology. They are asymptomatic in most patients.
Soft drusen
Soft drusen are larger than hard drusen and appear as extensive foci with blurred edges on the fundus. On OCT, they are dome-shaped and elevated above the PES and are divided into medium (63-125 μm) and large (more than 125 μm) in size. They are more strongly associated with AMD progression, especially when accompanied by pigmentary abnormalities and other OCT biomarkers (hyperreflective foci, destruction of the ellipsoidal zone, etc.). Soft drusen can enlarge and merge. An area of merging drusen with a diameter exceeding 350 μm is called a drusenoid detachment of the PES.
Soft drusen detected by Altris IMS. AI models are for Research Use Only. Not for use in diagnostic purposes.
Confluent drusen
These are multiple small deposits under the PES, which can occur in relatively young patients; on FAG they often show a “starry sky” appearance. On OCT, there are multiple small symmetrical elevations of the PES, small in diameter (like hard drusen), but more numerous, prone to merging. The course is variable: some patients maintain a stable course for years, some have an increased risk of complications and transition to the late stages of AMD.
Reticular pseudodrusen (or subretinal drusenoid deposits)
They differ fundamentally in their localization, being located above the PES (in the subretinal space). They contain some common proteins with soft drusen, but differ in lipid composition. Due to their close location to the important photoreceptor layer, they are more often combined with a decrease in visual function, and also carry a higher risk of progression to late AMD (especially characterized by a rapid transition to geographic atrophy (GA) and the development of macular neovascularization (MNV) type 3).
What are the levels of drusen?
The AREDS size classification is still useful in clinical practice: small <63 μm, medium 63–124 μm, large ≥125 μm. Analyses confirm that the 5-year risk of progression to late AMD increases with the number and size of drusen in both eyes and especially with the presence of reticular pseudodrusen. In the NICE guidance for the management of patients with AMD (2018), the risk of progression also depends on the size and type of drusen, as well as the presence of associated pathological changes (pigmentary abnormalities, vitelliform deposits).
The OCT era has added powerful quantitative metrics with AI for drusen measurement and monitoring:
- drusen height (μm),
- area (mm²),
- volume (mm³),
- topography (central ring within 1.5 mm; parafovea 3–5 mm),
- dynamics of changes and associated biomarkers (hyperreflective foci, ellipsoidal zone disruption, presence of hypertransmission zones, etc.).
A practically significant increase in the volume of drusen in the macular region over a year/two correlates with structural and functional deterioration (destructive changes in the photoreceptor layer, changes in ONL thickness, visual acuity). Data from multicenter projects (such as MACUSTAR) confirm the repeatability of measurements and the possibility of comparison between devices, provided that the correct algorithms are used.
What do drusen look like on OCT?
On B-scan OCT, classic hard and soft drusen are localized deposits of hyperreflective material between the PES and Bruch’s membrane (under the PES). Reflectivity can be uniform or heterogeneous depending on the structure and stage of development. Reticular pseudodruses are localized between the photoreceptor layer and the PES (above the PES) – this is the key difference from conventional drusen. On OCT images, they appear as tubercles in the subretinal space that remodel the outer layers of the retina (in particular, the ellipsoidal zone), and on en face, they are visualized as punctate structures, usually connected in a mesh pattern.
A: Soft drusen. B: Hard drusen (Source) Another classic white and black scan
In addition to the drusen themselves, clinically significant are hyperreflective foci, destruction of the ellipsoidal zone, thinning of the outer layers/ONL, formation of hyperreflective foci in OCT or geographic atrophy with the effect of hypertransmission – it is the combinations of these features that form prognostic models of the transition of intermediate AMD to late stages. The combination of these biomarkers consistently exceeds single morphometric thresholds.
En Face Optical Coherence Tomography Illustration of the Trizonal Distribution of Drusen and Subretinal Drusenoid Deposits in the Macula (Source)
As we can see, en face and linear OCT scans help to differentiate different types of drusen and track their progression dynamics. Modern deep learning models for AI drusen examination and en face analysis, like Altris.AI, reliably detect and segment classic drusen from subretinal drusenoid deposits, improving repeatability and reporting speed. You may see the difference from the classic white and black image analysis here:
Confluent drusen are highlighted by Altris IMS. AI models are used for Research Use Only. Not for use in Diagnostic Purposes.
How to measure drusen size?
Here we can find how drusen are measured:
1) Classical size scale (AREDS):
Orientation on diameter or equivalent on planar reconstructions: <63, 63–124, ≥125 μm. Convenient, but does not take volume/height or topography into account.
2) Quantitative OCT analysis of PES elevation:
On ZEISS CIRRUS instruments, the Advanced RPE Analysis module automatically calculates the area and volume of PES elevation in standard 3 and 5 mm rings around the fovea; the minimum height that the system consistently includes in quantitative results is about 19–20 μm. This provides repeatable metrics and a common “language of numbers” for clinical and research purposes.
3) Morphometric rule for differentiation of drusen and drusenoid detachment of PES:
By basal width: <350 μm – drusen, ≥350 μm drusenoid detachment of PES.
4) AI segmentation and 3D morphometry:
Deep networks segment Bruch’s membrane, PES, and ellipsoidal zone, as well as PES elevation on OCT, calculating drusen height/area/volume and generating dynamics maps. Validation work in 2023–2025 will demonstrate robustness between different OCT devices, which is critical for multicenter networks. Besides, you may track drusen progression on OCT AI tool and stay informed ahead of time to prevent more severe pathology changes in advance.
Can drusen exist without macular degeneration?
Yes, and this is possible in the following cases.
Small (<63 μm) single drusen may occur in the elderly in the absence of other signs of AMD and concomitant risk biomarkers (hyperreflective foci, ellipsoidal zone abnormalities). In this phenotype, the 5-year risk of progression is low; routine monitoring at an interval of 1 time per year is sufficient, if possible, with recording quantitative indicators on OCT (volume/area of PES elevation) for comparison in dynamics. The patient should be informed that the fact of “small drusen” alone does not equal a diagnosis of AMD and does not require treatment, but it is advisable to maintain lifestyle modification (blood pressure control, smoking cessation, a healthy diet).
Confluent drusen are sometimes found in younger patients; they do not always fit into the classic models of AMD. Tactics – individual observation with an emphasis on high-quality OCT documentation (the same scan and control of concomitant biomarkers). In the absence of “red flags”, a 6-12 month follow-up interval is sufficient.
Understanding Macular Degeneration (Source)
Hereditary dystrophies (EFEMP1-related; associated phenotypes are Doyne’s cellular degeneration of the retina and Leventis’ malady) form drusen-like deposits without the typical pathogenesis inherent in AMD. They have an autosomal dominant inheritance pattern and are characterized by yellow-white deposits, like drusen, accumulating under the PES, often in the peripapillary zone. The clinical picture may include gradual vision loss, impaired contrast sensitivity, or metamorphopsia. In this case, timely detection of the phenotype (age of onset, family history, symmetry, characteristic fundus appearance) and referral for medical and genetic counseling with a subsequent individual follow-up plan, including monitoring of possible complications (neovascularization, atrophic changes).
Drusen vs. drusenoid detachment of PES
Drusen are local elevations of PES above Bruch’s membrane due to deposits of pathological material under PES. Usually multiple, of different diameters, with a tendency to merge with the formation of larger, topographically continuous areas of PES elevation.
Drusenoid detachment of the pigment epithelium is formed from a larger conglomerate of drusenoid material, which in turn is formed as a result of the fusion of drusen.
Another differentiating drusen and drusenoid deposits subtypes on multimodal imaging samples
On B-scan OCT, it has smooth edges, uneven reflectivity, and often retains communication with neighboring drusen. On en face visualization, a conglomerate of elevation is visible, which corresponds to the zone of changes in the PES-Bruch’s membrane complex. In the absence of fluid inside the lesion, we are talking about drusenoid detachment of PES; if homogeneous hyporeflectivity is visualized under PES, this is serous detachment of PES, and if there are signs of a neovascular membrane according to OCTA or FAG, this is fibrovascular detachment of PES. Therefore, in doubtful cases, it is advisable to add OCTA to exclude hidden MNV.
The main morphometric rule: basal width ≥350 μm (in the horizontal projection of the OCT slice favors drusenoid detachment of PES. In some situations, we also pay attention to the content (serous/optically empty space, signs of vascularization), PES profile, and associated biomarkers, since PES detachment is more often associated with the risk of transition to HA or the formation of neovascularization.
What is the best treatment for drusen?
Drusen are not treated as a separate nosology. They are a structural biomarker of AMD, and also have prognostic value for assessing the further development and rate of progression of the disease.
Optimal tactics for detecting drusen:
Optimal tactics for detecting drusen may include the following
Risk modification:
- smoking cessation,
- blood pressure control,
- metabolic profile,
- diet.
Dietary supplements based on AREDS 2:
- taking antioxidant complexes (lutein, zeaxanthin, vitamins C and E, zinc, copper) reduces the risk of transition to late AMD by approximately 25% within 5 years (according to AREDS 2).
Quantitative monitoring on OCT:
- record the volume/area/height of drusen and their dynamics, distinguish between drusen types, detect other concomitant signs of AMD progression (hyperreflective foci, destructive changes in the ellipsoidal zone, pigmentary anomalies, vitelliform material deposition, signs of formation of foci of geographic atrophy).
- Individualize observation intervals (depending on the type of drusen, the dynamics of their structural changes and other risk factors).
- Among the new promising methods of treating dry AMD at the drusen stage is multiwavelength photobiomodulation.
Multiwavelength photobiomodulation:
This method is aimed at stopping or regressing the progression of dry AMD by modulating mitochondrial activity and consists of the use of specific light (red and near-infrared spectrum from ~590 to 850 nm), which can reduce oxidative stress in retinal cells, inflammation and apoptosis of PES cells.
The efficacy as a potential treatment approach has remained controversial until recently: studies have shown only temporary improvement in visual function and reduction in drusen volume (not maintained for 6 months).
Updated data from the LIGHTSITE III study were presented at the ARVO 2025 conference. They showed that photobiomodulation can significantly slow the decline in visual acuity and reduce the rate of expansion of HA zones
Recently, the FDA approved photobiomodulation for the treatment of AMD.
For complications:
- Neovascular AMD– anti-VEGF.
- Geographic atrophy – injectable drugs (inhibitors of the C3 and C5 complement system), approved by the FDA
The role of AI drusen quantification OCT
The role of AI: automated drusen-volume measurement in OCT is now a reality. IT allows automated segmentation and counting (3D volume, area, height), identification of reticular pseudodruses and other signs of AMD, and compilation of prognostic profiles.
In practice, applying an OCT drusen-counting algorithm reduces variability in assessments and helps personalize visit frequency. Additionally, home OCT monitoring models with AI analysis are being developed, indicating that broader AI support for AMD is fast approaching.
Conclusion
Drusen on OCT are more than just a sign of AMD. They have become one of the most important biomarkers of age-related macular degeneration and a kind of “compass” in the daily practice of an ophthalmologist. Today we understand that:
Drusen come in different types, and, accordingly, carry different prognostic information: hard, soft, confluent, and reticular pseudodrusen. Each type carries a different risk and requires a different surveillance strategy.
Drusen levels are no longer limited to diameter, height, volume, dynamics, and structural features as well as accompanying OCT biomarkers have also become important. It is the combination of these parameters that allows us to predict the transition to the late stages of AMD.
OCT has changed the game: drusen can now be seen in 3D, segmented automatically, build PES elevation maps, and compare data between visits. Thanks to this, the doctor receives a lot of information about the evolution of the disease.
AI sets a new standard: algorithms can accurately calculate drusen volume, identify their subtypes, generate prognostic profiles, and reduce interobserver variability. This translates data from subjective descriptions into objective, reproducible numbers.
Drusen classification on OCT using AI allows not only ascertaining the presence of drusen, but also differentiating their type, objectively measuring their number and parameters, and tracking their dynamics via AI drusen quantification on OCT. For the doctor, this means identifying risk factors in the early stages of retinal disease, accurately comparing data between visits, and prescribing the correct therapy promptly.
Home monitoring is the future that has already begun: the first FDA-approved solutions with “OCT + AI” are currently used to monitor fluid in neovascular AMD, but they pave the way for daily structural monitoring of drusen as well. This means that in the near future, the patient may be able to monitor their own retina at home, and the doctor may be able to see the dynamics in real time.
In the treatment of drusen wet or dry AMD, the main goal remains not to “remove drusen,” but to minimize risks (smoking, diet, systemic factors), prescribe AREDS2-based complexes, timely detect complications, and apply already available therapies (anti-VEGF in INM, C3 and C5 inhibitors of the complement system in HA). Among the new promising methods for treating dry AMD at the drusen stage is multiwavelength photobiomodulation.
It is important to remember when communicating with the patient: drusen is not a therapeutic target, but a structural “compass”. We do not “treat drusen.” Instead, we systematically reduce risks (smoking, blood pressure, nutrition), use drugs based on the AREDS2 formula, and most importantly, we regularly measure their quantitative parameters in dynamics. When complications appear and the transition to a late stage occurs, we prescribe treatment based on the same objective OCT metrics. Thus, instrumental accuracy and AI analytics turn drusen into a manageable marker that helps to timely detect the risks of AMD progression.
Thus, drusen on OCT have become a bridge between morphology and prognosis. They provide an opportunity to build a long-term strategy for preserving vision. Today, the doctor is required not only to see drusen, but also to quantitatively measure, assess in dynamics, calculate the risk, and explain to the patient his individual risks. It is thanks to these approaches that we are moving towards a new paradigm – personalized ophthalmology, where decisions are made based on objective digital data, enhanced by artificial intelligence.
Sources:
-
- https://pubmed.ncbi.nlm.nih.gov/39558093/
- https://jamanetwork.com/journals/jamaophthalmology/fullarticle/2765650
- https://link.springer.com/article/10.1007/s00417-024-06389-x
- https://iovs.arvojournals.org/article.aspx?articleid=2804052
- https://www.ophthalmologyscience.org/article/S2666-9145(25)00182-4/fulltext
- https://www.nature.com/articles/s41433-024-03460-z
- https://www.ophthalmologytimes.com/view/arvo-2025-update-on-the-lightsite-iii-study-in-amd
-
Central Retinal Vein Occlusion CRVO OCT: Detection and Modern Approaches to Monitoring and Treatment
Maria Znamenska
3 min.Introduction
Central Retinal Vein Occlusion (CRVO) OCT is one of the most common and clinically significant vascular disorders affecting the eye, often resulting in substantial visual impairment. This condition ranks second among causes of vision loss due to vascular disease, after diabetic retinopathy, placing a considerable burden on both healthcare systems and patients’ quality of life. Epidemiological studies show that the prevalence of RVO increases with age, and in populations with concomitant cardiovascular disease, the risk of developing occlusion rises severalfold.
Despite a long history of study, it is the breakthroughs in instrumental diagnostics over the past decade that have fundamentally changed our approach to recognizing and managing RVO. Previously, assessment of the macula and retinal vasculature relied primarily on ophthalmoscopy. While still an important tool, it has inherent limitations.
Optical coherence tomography (OCT) has revolutionized diagnostic standards. With its high resolution and ability to capture subtle structural changes within the retinal layers, OCT has become indispensable for determining disease severity, monitoring treatment efficacy, and conducting long-term follow-up. It allows for the detection of minimal early signs of edema, subclinical structural damage, and initial manifestations of ischemia—changes that were practically inaccessible for dynamic assessment 10–15 years ago.
This level of precision is particularly critical for patients at increased risk of RVO. The most vulnerable groups include individuals with arterial hypertension, diabetes mellitus, glaucoma, coagulation disorders, as well as older adults, in whom the vascular walls may already have undergone degenerative or sclerotic changes.
Importantly, modern RVO treatments require objective dynamic monitoring. OCT enables precise evaluation of structural changes, tracking of therapeutic response, and individualization of treatment strategies, helping to avoid both overtreatment and undertreatment.
Thus, the role of OCT today goes far beyond simple visualization: it is a key tool for prognostic assessment, patient stratification, optimization of therapeutic decisions, and timely detection of complications.
1. What RVO Is and Why It Occurs?
Central Retinal Vein Occlusion (CRVO) OCT is a disruption of venous blood outflow in the retina due to partial or complete vein occlusion. As a result, the following occur:
- Blood stasis
- Increased venous pressure
- Impaired capillary perfusion
- Retinal edema, especially in the macular area
- Risk of neovascularization
Early detection is critical, as prompt treatment—particularly for macular edema—significantly increases the chances of preserving or restoring vision. Delayed diagnosis can lead to progression of ischemia, neovascularization, neovascular glaucoma, and persistent macular dysfunction.
RVO also has important systemic implications: patients with a history of RVO have a higher risk of acute cardiovascular events (myocardial infarction, stroke, heart failure) compared with the general population. This emphasizes the need for comprehensive management, involving not only ophthalmologists but also other specialists, such as cardiologists.
Central vs. Branch Retinal Vein Occlusion: Pathogenesis Differences
- Central Retinal Vein Occlusion (CRVO) occurs when blockage happens at the level of the lamina cribrosa. Compression, arterial wall thickening, or thrombotic processes disrupt blood outflow from the entire retina. Typical signs include:
- Diffuse hemorrhages
- Marked macular edema
- Increased risk of optic disc and iris neovascularization due to severe ischemia
- Generally worsen prognosis than branch occlusions
- Branch Retinal Vein Occlusion (BRVO) usually occurs at arteriovenous crossings, where a thickened artery compresses a vein, causing localized occlusion. Characteristic features include:
- Localized edema and hemorrhages
- Clear segmental distribution
- Prognosis is generally better than that of CRVO, though macular edema may persist
Key Risk Factors for RVO
Modern studies and guidelines identify the following as the main risk factors:
- Arterial hypertension
- Atherosclerosis and age-related vascular changes
- Diabetes mellitus (even without diabetic retinopathy)
- Glaucoma and elevated IOP
- Hypercoagulable states, thrombophilia
- Obstructive sleep apnea
- Age >50 years
Rare cases of RVO associated with thromboembolic complications after COVID‑19 infection or vaccination have also been reported, highlighting the ongoing relevance of thrombotic mechanisms.
Impact on Microcirculation and Vision
RVO leads to:
- Impaired normal venous outflow
- Sharp elevation of hydrostatic venous pressure
- Damage to the blood-retinal barrier
- Leakage of plasma and cellular elements into the retinal interstitium, causing macular edema
- Development of ischemic zones
- Over time, thinning of inner retinal layers, neuroepithelial atrophy, and damage to the photoreceptor layer
These changes are best assessed with OCT, which enables precise patient stratification and treatment planning. Timely diagnosis, proper monitoring, and early therapy are essential.
2. OCT Signs of Retinal Vein Occlusion: Detecting Subtle Changes
With the advent of OCT, detection of structural retinal changes in RVO has significantly improved—even at early stages without obvious clinical signs.
Acute Stage Changes (first weeks after occlusion)
- Macular edema:
- Cystic spaces in inner retinal layers (INL, OPL)
- Increased central retinal thickness
- Subretinal fluid (serous neurosensory detachment)
- Intraretinal hemorrhages: appear on OCT as hyperreflective areas with shadowing of underlying layers
- Ischemia indicators:
- Hyperreflectivity of neuroepithelium
- Cotton-wool spots
Chronic Stage Changes (months later)
- Chronic ischemic and atrophic changes (thinning of inner retinal layers)
- Disruption of photoreceptor layer (ELM and EZ)
- Disorganization of inner retinal layers (DRIL)
- Persistent edema (>6 months) indicates chronic RVO requiring therapeutic adjustment
AI for OCT thus allows both acute diagnosis and long-term monitoring of ischemic progression or tissue remodeling.
3. Assessment of Macular Changes in RVO Using OCT
Central retinal vein occlusion crvo OCT is now considered the gold standard for diagnosing, monitoring, and assessing treatment response in macular edema, including that associated with RVO.
OCT is highly sensitive for:
- Quantitative and qualitative analysis (central retinal thickness [CRT], macular volume [MV], size and number of cystic spaces, DRIL, photoreceptor layer integrity)
- Evaluating treatment response
- Detecting minimal residual cysts
- Predicting visual acuity outcomes
Typical OCT Findings in RVO:
- Diffuse retinal thickening
- Cystoid macular edema (localized cysts deforming normal retinal architecture)
- Serous neurosensory detachment (indicative of blood-retinal barrier breakdown)
- Disruption of EZ and ELM (photoreceptor involvement, critical for final visual acuity)
These capabilities make OCT an integral part of modern RVO monitoring.
4. Top 3 Challenges in RVO OCT Analysis
Despite its power, OCT assessment of RVO has significant limitations:
- Need for normative comparison
Interpretation requires comparison with the patient’s contralateral eye or established normal values. Systemic vascular anomalies can affect both eyes, limiting standardization. - Complexity with comorbidities
Many RVO patients have systemic (hypertension, diabetes) or ophthalmic comorbidities (diabetic retinopathy, AMD, glaucoma, epiretinal membrane), complicating interpretation. It can be difficult to distinguish RVO-related changes from combined pathology. - Requirement to consider the clinical context
OCT provides only part of the clinical picture. Accurate interpretation requires integration of symptoms, medical history, systemic factors, fundoscopic findings, and other diagnostic tests. Anatomical variations, comorbidities (glaucoma, cataract), and individual treatment response also necessitate a personalized approach.
5. Treatment of RVO: Modern Approaches
Currently, no treatment restores normal retinal venous circulation. Therefore, therapy focuses on controlling complications, primarily macular edema and preventing neovascularization (retinal, iris/optic disc, neovascular glaucoma, hemorrhages, and tractional changes).
All RVO patients should receive systemic management, ideally in collaboration between an ophthalmologist and a cardiologist or internist. Monitoring of blood pressure, lipids, glucose, and coagulation factors is essential, as RVO often signals systemic vascular risk.
Treatment decisions must be individualized, considering:
- RVO subtype (CRVO vs. BRVO)
- Edema severity
- Clinical and OCT findings
- Risk of adverse effects
- Patient status (comorbidities, ability for regular follow-up)
Anti-VEGF Therapy as First-Line Treatment
Intravitreal anti-VEGF injections are the first-line therapy for macular edema associated with RVO. These drugs reduce vascular endothelial growth factor (VEGF) expression, lowering vascular permeability, fluid leakage, edema, and inhibiting pathological neovascularization.
Commonly used agents:
- Ranibizumab, Aflibercept, Faricimab: proven safe and effective for CRVO and BRVO-related macular edema brvo vs crvo oct; studies show significant improvements in best-corrected visual acuity (BCVA) and central macular thickness (CMT).
- Bevacizumab: used off-label for macular edema and neovascularization.
Long-term studies indicate anti-VEGF therapy provides sustained visual improvement for many patients, with injection frequency often decreasing over time.
Advantages:
- High efficacy for macular edema
- Good tolerability and safety (systemic complications are rare)
- Personalized treatment possible
Limitations / Challenges:
- Some patients respond insufficiently
- Requires frequent injections (clinic visits, financial burden, potential complications, patient discomfort)
- Chronic or refractory edema may require alternative or combination approaches
Steroid Implants and Injections: Second-Line Therapy
Dexamethasone intravitreal implant (OZURDEX) is approved for RVO-related macular edema, particularly when:
- Anti-VEGF therapy is insufficient
- Frequent injections are impractical (distance, transportation, cost)
Steroids reduce inflammation, vascular permeability, and fluid accumulation, useful in chronic or resistant edema.
Risks / Limitations:
- Cataract (especially with repeated or long-term use)
- Increased intraocular pressure (IOP), potential steroid-induced glaucoma
Laser Therapy
- Panretinal photocoagulation is effective for neovascularization.
- Its use has declined with anti-VEGF availability, which offers strong anatomical and functional results.
Surgical Approaches
- Vitrectomy may be considered in selected cases.
- Surgery carries risks and is reserved for situations where other treatments fail or are inappropriate.
Combination Strategies
- In practice, clinicians often combine anti-VEGF therapy with steroid implants or laser treatment, depending on disease course.
- This can reduce total injection burden, minimize side effects, and improve outcomes in chronic or recurrent edema.
Monitoring Frequency
- Active macular edema or ongoing treatment requires regular OCT follow-up to evaluate therapeutic response and adjust injection intervals.
- OCT schedule:
- Monthly at treatment initiation
- Individualized intervals using Treat-and-Extend protocols
- Structural monitoring to prevent atrophic changes
- Ischemic RVO patients have the highest neovascularization risk within the first 90 days; monthly monitoring during the first 6 months is critical.
Conclusions and Recommendations
RVO is a complex, multifactorial vascular disorder that can cause sudden and severe vision loss, particularly in patients with systemic risk factors. Modern management aims not only to address acute complications but also to control long-term structural retinal changes.
OCT has transformed RVO care by providing:
- Early detection of edema, subclinical ischemia, and architectural changes
- Dynamic monitoring of treatment response, allowing timely adjustments and optimization
- Improved long-term prognostication through evaluation of macular thickness, outer retinal layers, and fluid volume
OCT helps identify edema type and secondary changes—atrophy, photoreceptor damage, inner retinal thinning—allowing a more accurate visual prognosis, especially in ischemic RVO.
When combined with modern anti-VEGF agents, long-acting steroid implants, and personalized dosing regimens, OCT enables:
- Reduction of unnecessary injections via interval optimization
- Maximized treatment efficacy based on morphological findings
- Prevention of recurrence and progression through early detection of edema
Thus, OCT is not merely a visualization tool but a core element of clinical decision-making, improving patient management, preventing complications, and enabling more complete and stable visual recovery.
Clinical Recommendation: Integrate regular OCT assessments into RVO management, with attention to macular thickness dynamics and outer retinal layer integrity for precise disease control and optimized therapeutic outcomes.
References:
- https://pubmed.ncbi.nlm.nih.gov/38714470/
- https://www.rcophth.ac.uk/wp-content/uploads/2015/07/Retinal-Vein-Occlusion-Guidelines-Executive-Summary-2022.pdf
- https://www.mdpi.com/2077-0383/14/4/1183
- https://www.auctoresonline.org/article/clinical-therapeutic-orientation-in-retinal-venous-obstruction
- https://www.mdpi.com/2077-0383/10/3/405
- https://pmc.ncbi.nlm.nih.gov/articles/PMC10801953
- https://www.mdpi.com/2075-4418/13/19/3100
- https://karger.com/oph/article-abstract/242/1/8/255831/Microvascular-Retinal-and-Choroidal-Changes-in?redirectedFrom=fulltext
- https://link.springer.com/article/10.1007/s40123-024-01077-9
- https://pubmed.ncbi.nlm.nih.gov/39717563/
- https://provider-rvo.vision-relief.com/introduction/management/
-
Key Trends in Ophthalmology and Optometry in 2026
Maria Znamenska
3 min.Introduction
The year 2026 in ophthalmology will not be defined by a single “major breakthrough,” but rather by key trends in Ophthalmology and optometry in 2026, and the maturation of several directions whose discoveries and innovations are now transitioning into everyday clinical practice. While just a few years ago innovations were often perceived as isolated technologies far removed from real-world care (a new drug, device, or piece of equipment), today entire ecosystems are being formed: from early detection to long-term monitoring, from the ophthalmologist’s office to optometric screening, from a single consultation to a longitudinal patient journey supported by digital tools.
The core logic of 2026 is a shift from reactive to proactive ophthalmology. Increasingly, the goal is to prevent disease at the stage of risk-factor modification, intervene in the earliest pathological changes, and track preclinical markers. This shift is visible across several dimensions: the growing role of telemedicine and portable diagnostics; autonomous AI becoming a public health tool; and oculomics, which enables ocular image analysis to serve as a source of early biomarkers for systemic conditions. At the same time, the treatment paradigm is evolving: where repeated procedures once dominated (for example, frequent intravitreal injections), 2026 brings a move toward extended-duration regimens, implant-based drug delivery platforms, and disease control with fewer clinic visits.
Another important axis is the alignment of patient expectations. Some new approaches (for example, in the management of dry AMD and geographic atrophy) do not promise to “restore vision,” but rather to buy time—slowing structural retinal damage and functional vision loss. As a result, in 2026, risk–benefit communication and shared decision-making become almost as important as the choice of molecule or device itself.
Below, we outline the key eye care trends of 2026: what is changing, why it matters, and how it will shape ophthalmic and optometric practice.
1. New Approaches to Treatment
1.1. Geographic Atrophy (GA): The Introduction of Active Treatment in eye care trends 2026
1.1.1. Injectable Therapies as Ophthalmology Trends 2026
Following the key trends in Ophthalmology and Optometry in 2026 , development of injectable therapies for geographic atrophy, clinical practice is entering a “second wave” phase—where the main questions are no longer whether therapy is possible for a disease historically considered untreatable, but how that therapy should be practically implemented. In 2026, the focus will be on patient selection, treatment initiation, dosing frequency and duration, as well as monitoring.
Currently, the FDA has approved the following injectable therapies for GA:
- Izervay (avacincaptad pegol) — a C5 complement inhibitor.
- Syfovre (pegcetacoplan) — a C3 complement inhibitor.
Their mechanism of action involves reducing chronic inflammation and cellular damage in the retina and—most importantly—slowing the rate of GA lesion expansion.
Because most available data focus on slowing atrophy progression (an anatomical endpoint) rather than guaranteed improvements in visual acuity, properly managing patient expectations becomes particularly critical in 2026. Clear discussions about therapeutic goals and limitations are emphasized in review publications addressing the first approved GA treatments.
1.1.2. Multiwavelength Photobiomodulation
Multiwavelength photobiomodulation is one of the most promising emerging approaches and key trends in Ophthalmology and Optometry in 2026 aimed at halting or slowing the progression of dry AMD through modulation of mitochondrial activity. The use of specific wavelengths (red and near-infrared light, approximately 590–850 nm) may reduce oxidative stress in retinal cells, inflammation, and apoptosis of retinal pigment epithelium cells.
Its appeal is clear: a non-invasive procedure with significantly better acceptability for some patients compared with regular injections.
Until recently, its effectiveness remained debated, with studies showing only temporary functional improvement and reduction in drusen volume. At ARVO 2025, updated results from the LIGHTSITE III study demonstrated that photobiomodulation can significantly slow visual acuity decline and reduce the rate of GA expansion.
In 2025, the FDA approved photobiomodulation for AMD, creating strong prospects for broader clinical adoption in 2026.
The 2026 trend is correct positioning and stratification:
- Use of photobiomodulation based on clear indications for specific dry AMD stages and patient profiles.
- Transparent communication of expectations, with goals focused on functional support and slowing GA progression rather than guaranteed vision restoration.
1.2. Extended Anti-VEGF Treatment Regimens
Another major trend is the shift toward regimens with reduced injection frequency. This is not merely about comfort, but primarily about preventing missed visits: patients with AMD and diabetic retinopathy with DME often fall out of treatment due to visit burden. Thus, 2026 reinforces the principle that treatment must be effective in real-world conditions, not only under ideal adherence.
The ranibizumab port delivery system (Susvimo, Port Delivery System) has become emblematic of this trend. In 2025, the FDA also approved Susvimo for the treatment of diabetic retinopathy.
1.3. Gene Therapy for Macular Telangiectasia Type 2 (MacTel 2)
MacTel 2 is a chronic, progressive neurodegenerative retinal disease that previously lacked active treatment.
In 2025, the first implantation of ENCELTO (revakinagene taroretcel)—the first and currently only FDA-approved gene therapy for MacTel 2—was performed in the United States. ENCELTO enables a shift from observation to active intervention, with the potential to preserve visual function in early-stage patients.
The device is based on encapsulated cell therapy technology: a capsule containing genetically modified cells that continuously secrete recombinant human ciliary neurotrophic factor (CNTF), acting as a neuroprotective agent that slows photoreceptor degeneration.
In 2026, the focus will move from “innovation storytelling” to routine clinical implementation, including defining early selection criteria, monitoring protocols (OCT biomarkers, functional testing), and accumulating real-world long-term data on photoreceptor preservation and visual function.
1.4. Gene Therapy for Neovascular AMD: Closest to Real Transformation
For neovascular AMD, gene therapy remains one of the most anticipated eye care trends 2026 directions, as it has the potential to fundamentally change treatment logic—from repeated injections to a single vector administration enabling long-term therapeutic protein expression. Reviews published in 2025 highlight active programs such as RGX-314, ADVM-022 (Ixo-vec), 4D-150, and others.
In 2026, the key questions shift from “does it work?” to “how does it work across different patient groups?” including:
- Stability and duration of expression;
- Inflammatory and immune response profiles;
- Need for supplemental anti-VEGF therapy;
- Patient selection criteria;
Injection centers and post-procedure monitoring standards.
2. Oculomics: The Eye as a “Window to the Body” and a Source of Digital Biomarkers
Oculomics is one of the most compelling trends of 2026, as it reshapes ophthalmology’s role within medicine as a whole. The concept is simple: the eye is the only structure where microvasculature, neurons, and signs of metabolic and inflammatory processes can be visualized non-invasively at high resolution. As a result, fundus and OCT/OCTA data may serve as biomarkers for systemic conditions—from cardiovascular risk to neurodegenerative diseases.
In contemporary research, oculomics is described as an approach that uses retinal images to assess systemic risks and conditions, with potential scalability for screening. In 2026, this “scale” becomes critical: data may originate not only from ophthalmology clinics, but also from optometric practices, mobile screening programs, and telemedicine.
What truly changes in 2026:
- A transition from “interesting correlations” to clinical utility, with models expected to demonstrate actionable impact on patient management.
- Data verification and management of false-positive risk, including the communication of systemic risk to patients.
- Integration with AI, as multidimensional patterns often exceed human interpretive capacity.
A major risk in 2026 is over-marketing, reinforcing the need for externally validated models with clear clinical context that do not generate unnecessary “medical noise.”
3. AI Technologies: From Decision Support to Autonomous Screening and Managed Patient Pathways
3.1. Autonomous Diabetic Retinopathy Screening as a Scalable Standard
In 2026, diabetic retinopathy remains the most studied use case for autonomous AI. In the United States, three FDA-approved autonomous DR screening systems are already described (LumineticsCore/IDx-DR, EyeArt, AEYE-DS). This positions AI as a practical tool capable of influencing large-scale screening programs, particularly in primary care, endocrinology clinics, and mobile settings.
The FDA approval of AEYE-DS as a fully autonomous solution (portable camera plus algorithm) underscores that in 2026, AI increasingly “works where the patient is,” not only where an ophthalmologist is present.
3.2. 2026 as the Year of Integration
Successful projects in 2026 will be distinguished by:
- Image quality standards and quality control;
- Clear referral rules and urgency levels;
- Mechanisms to ensure patient follow-through (scheduling, reminders, visit tracking);
- Transparent documentation for clinicians, patients, and audit purposes.
3.3. AI as “Invisible Infrastructure”
In 2026, AI increasingly functions as invisible infrastructure: highlighting high-risk cases, prioritizing queues, generating structured reports, and standardizing interpretation. The impact is reduced variability, faster routing, and fewer missed cases.
4. Telemedicine: From Video Calls to Retinal Screening and Remote Management
By 2026, telemedicine in ophthalmology is no longer synonymous with video consultations. Its foundation is tele-imaging: transmission and assessment of retinal images (fundus photos, sometimes OCT) with structured referral protocols.
At the same time, limitations become more openly discussed. Certain conditions and components of assessment may be less accurately captured remotely, requiring clear protocols to define which patients can be managed remotely and which require in-person examination.
The 2026 trend is a shift from “tool” to “pathway”:
- Tele-screening as the first step;
- Automated or semi-automated reporting;
- Referral and follow-up control;
Remote reassessment for ongoing risk monitoring.
5. New Devices and Portable Diagnostics: Closer, Faster, More Scalable Care
5.1. Portable Diagnostics as the Foundation of Coverage
Portable fundus cameras and compact diagnostic systems represent one of the most practical changes of 2026. Their value lies not only in technology, but in enabling large-scale screening in locations without full ophthalmic infrastructure.
Synergy with autonomous AI (such as AEYE-DS) is especially strong here, supporting new partnership models:
- Endocrinology and primary care clinics;
- Optical stores and optometric practices;
- Mobile programs for workplaces or regions.
5.2. Devices Deliver Value Only with Quality Protocols
Success depends not just on acquiring devices, but on defined protocols:
- Staff training in image acquisition;
- Minimum quality criteria;
- Retake rules;
- Handling ungradable cases.
In 2026, image quality becomes decisive, as AI and telemedicine depend on it.
5.3. Home and Remote Monitoring for Extended Treatment Regimens as eye care trends 2026
As treatment intervals lengthen, the risk of between-visit deterioration increases. Thus, 2026 strengthens the role of:
- Home functional monitoring;
- Digital questionnaires and symptom trackers;
Remote checkpoints signaling the need for earlier recall.
6. 2026 as the Year of Standardized Myopia Control and Greater Risk Awareness
By 2026, myopia control is no longer debated but formalized, grounded in consensus documents and systematic reviews. Myopia is increasingly recognized as a chronic disease with stages, phenotypes, and potentially blinding complications.
Implications for practice:
- Focus on preventing progression to high myopia.
- Combined strategies integrating behavioral, optical, and pharmacologic interventions with monitoring.
- A shared language between optometrists and ophthalmologists, with coordinated patient pathways.
- Support from AI and telemedicine for risk detection and personalized care.
Myopia control in 2026 becomes a structured, long-term risk-reduction process.
7. Optogenetics: Expanding the Evidence Horizon in Inherited Retinal Degenerations
In 2026, optogenetics moves beyond concept into longer-term observation. Publications from 2025 highlight functional stabilization or improvement in retinitis pigmentosa, emphasizing pragmatic success criteria.
For patients with severe vision loss, meaningful outcomes extend beyond visual acuity charts to spatial orientation, object recognition, and contrast sensitivity. In 2026, discussions increasingly focus on realistic endpoints and honest communication of limitations.
8. Less Invasive Interventions and Patient Comfort as Components of Clinical Effectiveness
Another key eye care trends 2026 is less traumatic technology that preserves efficacy while improving patient experience. A notable example is the FDA approval of Epioxa (epi-on) for keratoconus in 2025, preserving corneal epithelium and potentially reducing pain and recovery time.
This trend spans refractive surgery, ocular surface disease, and chronic condition management, reinforcing that patient experience is integral to adherence and clinical outcomes.
Conclusion
The ophthalmology trends 2026 clearly demonstrate that ophthalmology and optometry are entering a phase of mature transformation, where success is driven not by isolated innovations but by their integration into coherent clinical pathways. The focus is shifting from treating consequences to early detection, slowing progression, and long-term management of chronic eye disease.
Active treatment of geographic atrophy, photobiomodulation, extended anti-VEGF regimens, and the emergence of gene therapies for MacTel 2 and neovascular AMD fundamentally reshape patient management—from observation or frequent procedures to strategies aimed at preserving retinal structure and function with minimal procedural burden. These approaches require careful patient stratification and responsible expectation management, as the goal increasingly becomes slowing neurodegeneration rather than restoring vision.
At the diagnostic level, 2026 reinforces decentralization: portable devices, telemedicine, and autonomous AI bring screening closer to patients and enable coverage of much broader populations. Oculomics and AI transform ocular images into sources of digital biomarkers that may influence not only ophthalmic but also general clinical management. At the same time, it becomes clear that technological value is defined not by algorithms or devices, but by data quality, model validation, and clearly structured patient pathways—from screening to treatment.
-
Diabetic Retinopathy Screening and Treatment: a Complete Guide
Maria Znamenska
5 minDiabetic retinopathy screening and treatment: a complete guide
Table of Contents
- What are the diabetic retinopathy screening methods?
- Fundus images in DR screening
- Can OCT detect diabetic retinopathy?
- What does diabetic retinopathy look like on OCT?
- What is optimal diabetic retinopathy screening frequency?
- What is the best treatment for diabetic retinopathy?
- Diabetic retinopathy management: key takeaways
Diabetic retinopathy (DR) remains the leading cause of irreversible vision loss among working-age adults worldwide. According to the International Diabetes Federation (IDF), one in three patients with diabetes shows signs of DR, and 10% develop diabetic macular edema (DME). Early diagnosis, systematic screening, and individualized monitoring are essential to prevent vision loss.
What are the diabetic retinopathy screening methods?
Modern methods of DR screening include:
- Telemedicine platforms – enable automated transmission of fundus images
- Mobile fundus cameras – Wi-Fi–enabled devices for field examinations
- Smartphone-based platforms – use specialized lenses for retinal imaging
- Optical coherence tomography (OCT) – used to detect early retinal changes and diabetic macular edema, complementing fundus photography
- AI-based systems – solutions for automated image analysis for fundus and OCT
In practice, these methods are often combined. For example, patients may undergo fundus photography, after which images are sent to telemedicine centres and analysed by AI algorithms. More complex cases are then referred to ophthalmologists.
DR screening is frequently incorporated into annual diabetes check-ups conducted by primary care physicians trained in basic fundus photography. This approach, already successfully implemented in several EU countries, has reduced the incidence of severe DR.
Innovations in DR screening have broadened access for rural residents, older adults, and individuals with limited mobility. Integration into national e-health systems enables automated reminders and electronic medical record linkage, incorporating laboratory data (HbA1c, blood pressure) alongside retinal images.
Fundus images in DR screening
Fundus photography is the optimal primary screening method due to its high diagnostic yield, cost-efficiency, simplicity, and ability to integrate with AI and telemedicine solutions.
It enables detection of microaneurysms, hemorrhages, exudates, and neovascularization, often before symptoms arise. National screening programs rely heavily on digital fundus imaging, which, when combined with AI, provides an efficient platform for mass DR detection.
Advances in fundus imaging for diabetic retinopathy have improved efficiency. Modern non-mydriatic cameras deliver high-quality images without pupil dilation, while automated image analysis supports rapid identification of suspicious cases. Cloud storage and telemedicine platforms facilitate remote evaluation, increasing coverage in regions with limited ophthalmology services.
Next-generation wide-field cameras further enhance detection by capturing peripheral pathology. Some devices also generate automated annotations, reporting lesion type, DR stage, and DME presence, thereby standardizing interpretation and expediting clinical decision-making.
Diabetic retinopathy detection from fundus images Can OCT detect diabetic retinopathy?
Yes. OCT can detect early structural changes in the retina and is increasingly used to complement standard diabetic retinopathy screening.
- Role in DR screening – While not a primary screening tool, OCT is now widely applied alongside fundus photography. It is especially valuable for detecting early diabetic macular edema (DME) and subtle morphological changes in the central retina not visible during ophthalmoscopy.
- High-resolution imaging – OCT visualizes changes such as photoreceptor layer disruption, subclinical intraretinal fluid, neurosensory retinal thickening, and foveal edema. These findings often appear before clinically significant macular edema.
- Differential diagnosis – OCT also helps identify other causes of vision loss in diabetic patients, for example, ruling out age-related macular degeneration.
- Clinical evidence – Studies confirm that combining OCT with fundus photography increases diagnostic accuracy for DME. Experts therefore recommend this approach for patients with long-standing diabetes, poor glycemic control, or vision complaints.
What does diabetic retinopathy look like on OCT?
On OCT, diabetic retinopathy (DR) can appear as a combination of retinal structural damage, fluid accumulation, and microvascular changes that may not be visible on fundus photography.
Typical OCT findings in DR include:
- Photoreceptor damage – loss of outer retinal layers, especially the ellipsoid zone
- Intraretinal hyperreflective foci, hard exudates
- Microaneurysms – visible as small, round changes within the retina
- Retinal thickness changes and neuroepithelial layer atrophy
- Diabetic macular edema – with intraretinal hyporeflective cystoid spaces and neuroepithelial swelling
- Subretinal fluid – resulting from increased vascular permeability
- DRIL – disorganization of inner retinal layers, associated with poor prognosis
- Epiretinal membranes – potential precursors to retinal detachment
Advanced findings
OCT can also reveal proliferative changes and tractional zones, which may progress to tractional retinal detachment.OCTA insights
Beyond structural analysis, OCT angiography (OCTA) allows visualization of retinal microvascular changes without the contrast injection. OCTA helps identify areas of neovascularization, capillary network disruption, and the degree of macular ischemia.Diabetic retinopathy (hyperreflective foci, moderate destruction of the ellipsoid zone and RPE), diabetic macular edema (neuroepithelium edema, intraretinal cystic cavities), epiretinal membrane What is optimal diabetic retinopathy screening frequency?
The screening frequency for diabetic retinopathy is tailored to diabetes type, disease stage, and risk factors:
Type 1 diabetes
- First screening: 3–5 years after diagnosis (due to onset in children and young adults)
- Then annually, if no DR is detected
- If DR is present, frequency depends on severity
Type 2 diabetes
- Screening at diagnosis, as DR may already be present.
- If no DR, repeat every 1–2 years.
Patients with confirmed DR
- No visible DR, mild non-proliferative diabetic retinopathy (NPDR), no DME — every 1–2 years
- Moderate NPDR — every 6–12 months.
- Severe NPDR — every 3 months.
- Proliferative DR (PDR) — monthly, with regular OCT monitoring of the macula.
- DME — monthly if center-involving, every 3 months if not.
Pregnant women with type 1 or type 2 diabetes
- Screening before conception or in the first trimester, with follow-up each trimester and postpartum
- Screening is not required for gestational diabetes without pre-existing diabetes
Post-treatment patients (laser or vitrectomy)
- Typically, every 3–6 months during the first year, individualized based on retinal stability
Diabetic retinopathy (hyperreflective foci, microaneurysms, destruction of the ellipsoid zone and RPE), diabetic macular edema (neuroepithelial swelling, intraretinal cystic cavities), epiretinal membrane. Monitoring of diabetic retinopathy progression
Ongoing diabetic retinopathy monitoring is essential to detect early signs of progression and guide treatment decisions. A key focus in monitoring is diabetic macular edema (DME), which represents fluid accumulation in the macula due to leakage from damaged retinal vessels. DME is a common complication of DR and the leading cause of vision loss in diabetic patients. OCT plays a central role in detecting DME and identifying structural changes that indicate disease progression.
OCT biomarkers in DME
OCT enables precise visualization of retinal layers with micron resolution, confirming DME presence and providing prognostic biomarkers for treatment selection and monitoring.
The main OCT biomarkers in DME include:
- Cystoid hyporeflective intraretinal spaces – usually in the inner nuclear layer (INL) or outer plexiform layer (OPL). Their number, size, and location correlate with edema severity. Large or confluent spaces may indicate chronicity and a worse prognosis.
- Subretinal fluid – accumulation between the neurosensory retina and retinal pigment epithelium. Often associated with a better visual prognosis, but requires close monitoring and consideration in anti-VEGF therapy.
- Central macular thickening – a key marker of treatment effectiveness and disease activity.
Diabetic retinopathy (hyperreflective foci, hard exudates), diabetic macular edema (neuroepithelial swelling, intraretinal cystic cavities). OCT red flags in DR progression
Beyond DME, OCT helps identify broader signs of DR worsening that require therapy reassessment:
- Progressive central macular thickening despite treatment
- Increase in intraretinal or subretinal fluid, or enlargement of cystoid spaces
- New hyperreflective foci, reflecting inflammatory activity (these may precede hard exudates or RPE changes)
- Development or progression of disorganization of inner retinal layers (DRIL), an independent predictor of poor prognosis, even when orphological improvement is seen on OCT
- Ellipsoid zone disruption, indicating photoreceptor damage
- Signs of macular ischemia, although better evaluated with OCTA, indirect signs on OCT may include thinning of the inner retinal layers.
- Tractional changes, such as epiretinal membranes, inner retinal stretching, or macular traction
Diabetic retinopathy (hyperreflective foci, hard exudates, destruction of the ellipsoid zone and RPE, disorganisation of the retinal inner layers (DRIL)), Diabetic macular edema (neuroepithelial swelling, intraretinal cystic cavities), subretinal fluid. The appearance of these OCT features should prompt clinicians to reconsider therapy, whether by switching anti-VEGF agents, introducing steroids, using combination therapy, or referring patients for surgical evaluation when traction is present.
Diabetic retinopathy (hyperreflective foci, hard exudates, destruction of the RPE), Diabetic macular edema (neuroepithelial swelling, intraretinal cystic cavities), subretinal fluid. What is the best treatment for diabetic retinopathy?
The treatment of diabetic retinopathy is based on a comprehensive approach that takes into account not only the disease stage, but also individual patient characteristics, OCT findings, comorbidities, and prognostic biomarkers. Modern strategies combine preventive, pharmacological, and surgical methods, as well as personalized medicine tools based on retinal imaging.
Criteria for treatment selection
The choice of therapy is guided by the following parameters:
- DR stage – non-proliferative, proliferative, with or without DME
- Form of macular edema – focal, diffuse, with or without subretinal fluid
- Presence of DRIL, EZ disruption, ischemic changes on OCTA
- Response to previous treatment – anti-VEGF, steroids, laser
- Comorbidities – renal insufficiency, hypertension, poor adherence
For low-risk patients, observation or focal laser may be sufficient. Patients with significant DME usually require anti-VEGF or steroid injections. Those with proliferative DR often undergo panretinal laser photocoagulation or vitrectomy.
Diabetic retinopathy treatment methods
The main treatment options for diabetic retinopathy include pharmacotherapy, laser therapy, surgical intervention, and personalized approaches based on OCT.
1. Pharmacotherapy: anti-VEGF and steroids
Anti-VEGF agents such as aflibercept, ranibizumab, and bevacizumab are the first-line therapy for diabetic macular edema. They are especially effective in patients with pronounced edema and without ischemia.
New drugs with extended duration of effect, including port delivery systems, are becoming available.
Steroids are used when DME is persistent, when patients do not respond to anti-VEGF therapy, or in cases with an inflammatory phenotype.
2. Laser therapy
Injections have largely replaced laser therapy in the treatment of DME. However, panretinal photocoagulation remains the standard treatment for proliferative DR.
Subthreshold micropulse laser is increasingly applied for focal edema, as it minimizes tissue damage.
3. Surgical treatment
Vitrectomy is recommended in cases of tractional macular edema, vitreous hemorrhage, or retinal detachment.
4. Personalization with OCT
Modern treatment protocols use OCT biomarkers to tailor therapy and improve prognosis.
Patient education and multidisciplinary care
DR treatment outcomes strongly depend on adherence. Patients must be informed about the need for regular injections, monitoring, and systemic control. Coordinated care involving ophthalmologists, endocrinologists, and family doctors helps maintain stable glycemic control and slows DR progression.
Diabetic retinopathy management: key takeaways
Diabetic retinopathy is a progressive disease, but modern diagnostics and treatments make it possible to preserve vision and improve outcomes. OCT and OCTA have become essential tools for early detection, risk assessment, and personalized therapy planning. Effective management combines pharmacotherapy, laser treatment, surgery, and patient education. Multidisciplinary care and strong patient adherence remain crucial for long-term success. With timely monitoring and tailored treatment, the progression of diabetic retinopathy can be significantly slowed.
Disclaimer: USA FDA 510(k) Class II; Altris Image Management System (Altris IMS); AI/ML models and components intended to use for research purposes only, not for clinical diagnosis purposes.
-

Altris Achieves MDSAP Certification, Strengthening Global Presence and Clinical Credibility
Altris Inc.
22.08.20251 min.22.08.2025
Altris Achieves MDSAP Certification, Strengthening Global Presence and Clinical Credibility
Altris Inc., a leading decision support platform for OCT scan analysis, proudly announces that it has passed the Medical Device Single Audit Program (MDSAP) audit.
Based on the objective evidence reviewed, this audit enables a recommendation for Initial certification to ISO 13485:2016 MDSAP, including the requirements of Australia, Brazil, Canada, the USA, and Japan, and EU 2017/745, and that the scope was reviewed and found to be appropriate for ISO 13485:2016/MDSAP and EU MDR 2017/745.
The results of this audit are suitable for obtaining the EU MDR 2017/745 certificate, which we are currently in the process of pursuing.
ISO 13485:2016/MDSAP enables Altris Inc. to “design, manufacture, and distribute medical software for the analysis and diagnosis of retinal conditions globally.” It is recognized by leading global health regulators and signals trust and credibility to public and private hospitals, eye care networks, and optometry chains worldwide.
MDSAP Certification also opens the door for Altris Inc. to enter new international markets, including Asia-Pacific, Latin America, and additional parts of North America. The MDSAP certification allows a single regulatory audit of Altris AI’s Quality Management System (QMS) to be recognized by multiple major health authorities, including:
- FDA (United States)
- Health Canada
- TGA (Australia)
- ANVISA (Brazil)
- MHLW/PMDA (Japan)
MDSAP enforces that the Quality Management System for developing, testing, and maintaining AI Decision Support for OCT complies with international medical device standards. Altris AI Decision Support for OCT Analysis system that facilitates the detection and monitoring of over 70 retinal pathologies and biomarkers, including early signs of glaucoma, diabetic retinopathy, and age-related macular degeneration.
“Achieving ISO 13485:2016 certification under the stringent MDSAP requirements is a significant accomplishment for our team,” said Maria Znamenska, MD, PhD, Chief Medical Officer at Altris AI. “As a practicing ophthalmologist, I understand that the safety of patients is the absolute priority. Especially when implementing such an innovative technology as AI for decision support in OCT analysis. That is why we did everything possible to build quality processes that guarantee the highest level of safety for the patients.
This certification enables Altris AI to expand its presence and offer eye care specialists upgraded functions such as GA progression monitoring, flags for smart patient filtering, or automated drusen count.”
“This is more than a regulatory milestone for our team – it’s a signal to the global eye care community that Altris AI is a trusted clinical partner,” said Andrey Kuropyatnyk, CEO of Altris AI.
About Altris
Founded in 2017, Altris AI is at the forefront of integrating artificial intelligence analysis into ophthalmology and optometry.
The company’s platform is designed to assist eye care professionals in interpreting OCT scans with greater objectivity and make informed treatment decisions. It’s a vendor-neutral platform compatible with OCT devices from 8 major global manufacturers. With a commitment to innovation and compliance, Altris AI continues to develop solutions that set higher standards in the eye care industry and improve patient outcomes.
Disclaimer: USA FDA 510(k) Class II; Altris Image Management System (Altris IMS); AI/ML models and components intended to use for research purposes only, not for clinical diagnosis purposes.
-
Glaucoma OCT Monitoring Guide: From Detection to Long-Term Care
Maria Znamenska
5 minGlaucoma OCT Monitoring Guide: From Detection to Long-Term Care
Table of Contents
- Glaucoma detection: why early diagnosis is critical
- How to detect glaucoma in early stages: key approaches
- Advanced imaging for glaucoma: OCTA
- OCT glaucoma monitoring after diagnosis
- Additional tools for monitoring glaucoma treatment
- Glaucoma OCT: the foundation of long-term glaucoma care
Optical Coherence Tomography (OCT) has fundamentally changed glaucoma diagnostics over the past two decades. It enables non-invasive, micron-level imaging of retinal microstructures and provides objective measurements of the retinal nerve fibre layer (RNFL), ganglion cell complex (GCC), and optic nerve head (ONH) parameters. Moreover, the advent of OCT angiography (OCTA) has introduced a new dimension in assessing microcirculation—complementing structural analysis and potentially predicting glaucoma progression.
Today, OCT is the standard for early detection, monitoring, and risk stratification of glaucoma progression, as recognised in international clinical guidelines. When combined with functional tests, tonometry, and anterior chamber angle assessment, OCT becomes the foundation for personalised glaucoma management.
Glaucoma detection: why early diagnosis is critical
Early glaucoma diagnosis is vital, as optic nerve damage caused by the disease is irreversible. Many patients seek care only after significant vision loss has occurred, at which point treatment may slow progression but cannot restore lost function. This is why ophthalmologists emphasise the importance of glaucoma detection at preclinical or pre-perimetric stages.
How does OCT help in early glaucoma detection?
OCT provides high-resolution imaging of the retina and optic nerve head. Unlike subjective functional tests, OCT delivers objective, quantitative data on ganglion cells, nerve fibre layers, and the neuroretinal rim, enabling recognition of even subtle structural changes.
Recent OCT models go further, allowing detailed visualisation of the lamina cribrosa, a structure known to be altered in glaucoma. Today, OCT is recognised as a key diagnostic tool in the guidelines of both the European Glaucoma Society and the American Academy of Ophthalmology.
How to detect glaucoma in early stages: key approaches
Early glaucoma detection relies on evaluating structural and functional parameters of the eye, supported by advanced imaging techniques. The three main parameters assessed with glaucoma OCT are:
- Ganglion Cell Complex (GCC) thickness and asymmetry
- Retinal Nerve Fibre Layer (RNFL) thickness
- Optic nerve head parameters with the DDLS scale
In addition, OCT Angiography (OCTA) provides complementary insights into ocular microvasculature that may indicate early glaucomatous damage.
Glaucoma detection parameter 1: GCC thickness and asymmetry
One of the most sensitive preclinical biomarkers of glaucomatous damage is thinning of the ganglion cell complex (GCC), which includes the ganglion cell layer (GCL), inner plexiform layer (IPL), and macular RNFL (mRNFL). It is assessed through macular OCT scans. Damage in this area is particularly critical, as 50–60% of all ganglion cells are concentrated within the central 6 mm zone.
Assessing asymmetry between the superior and inferior halves of the macula within the GCC is a key diagnostic indicator. Studies show that minimum GCC thickness and FLV/GLV indices (Focal Loss Volume / Global Loss Volume) are predictors of future RNFL thinning or emerging visual field defects. Asymmetry maps significantly ease clinical interpretation.
A newer approach—vector analysis of GCC loss—also allows clinicians to visualise the direction of damage, which often correlates with future visual field defects.

Glaucoma detection parameter 2: RNFL thickness analysis
RNFL analysis is among the most widely used glaucoma diagnostic methods. The RNFL reflects the axons of the ganglion cells and is readily measured in optic nerve scans. Temporal sectors are the most sensitive and often show the earliest changes.
Even when the overall thickness appears normal, localised defects should raise suspicion. Sectoral thinning of ≥5–7 μm is considered statistically significant. Age-related RNFL decline (~0.2–0.5 μm/year) must also be considered.
Glaucoma detection parameter 3: optic nerve head parameters and the DDLS scale
Evaluating the optic nerve head (ONH) is essential. OCT enables automated assessment of optic disc area, cup-to-disc ratio (C/D), cup volume, rim area, and the lamina cribrosa.
The Disc Damage Likelihood Scale (DDLS) classifies glaucomatous ONH changes based on the thinnest radial rim width or, if absent, the extent of rim loss. Unlike the C/D ratio, DDLS adjusts for disc size. When combined with OCT, DDLS significantly enhances objective clinical assessment.
In high myopia, automatic ONH segmentation often misclassifies anatomy. Here, newer deep learning–based segmentation models improve accuracy.
Advanced imaging for glaucoma: OCTA
OCT Angiography (OCTA), an advanced glaucoma OCT technique, provides unique insights into ocular circulation. It enables evaluation of:
- Vessel density in the peripapillary region
- Optic nerve and macular vascularisation
- Retinal versus ONH perfusion in both eyes
Studies confirm that reduced vessel density correlates with RNFL loss and visual field deterioration, and often precedes both.
OCT glaucoma monitoring after diagnosis
Glaucoma can progress even with stable intraocular pressure (IOP), making regular structural assessment of the optic nerve and inner retina crucial for therapy adjustment.
Glaucoma OCT is not only a diagnostic tool but also the primary method for monitoring glaucomatous damage. Unlike functional tests, OCT can detect even minimal RNFL or GCL thinning months or even years before visual field loss appears. With serial measurements and built-in analytics, OCT allows clinicians to track glaucoma progression rates and identify high-risk patients.
Methods for glaucoma progression monitoring
There are two main approaches to monitoring glaucoma progression with OCT:
Method 1: event-based analysis
This method compares current scans with a reference baseline, identifying whether RNFL or GCL thinning exceeds expected variability.
? Example: Heidelberg Eye Explorer (HEYEX) highlights suspicious areas in yellow (possible loss) or red (confirmed loss).
Limitations include sensitivity to artifacts, image misalignment, and segmentation quality. A high-quality baseline scan is essential.
Method 2: trend-based analysis
This approach accounts for time. The software plots RNFL/GCL thickness trends over time in selected sectors or globally and calculates the rate of progression.
Examples:
- RNFL thinning >1.0 μm/year is clinically significant.
- Thinning >1.5 μm/year indicates active progression.
It also accounts for age-related changes, helping differentiate physiological vs. pathological decline.
Visual assessment in glaucoma OCT
Qualitative analysis also plays an important role in detecting glaucoma progression. Key aspects include:
- Focal RNFL thinning (localised defects)
- Changes in the neuroretinal rim
- Alterations in ONH cupping
- GCL/GCIPL comparison (superior vs. inferior) on macular maps
- New segmentation artifacts (may mimic progression)
OCT glaucoma findings that indicate true progression
Five OCT findings suggest true glaucomatous progression:
- RNFL thinning >10 μm in one sector or >5 μm in several sectors
- New or worsening GCL asymmetry (yellow to red colour shift)
- Emerging or expanding RNFL defects on colour maps
- Increasing C/D ratio with concurrent rim thinning
- New localised areas of vessel density loss on OCTA
Particular attention should be paid to the inferotemporal and superotemporal RNFL sectors, where 80% of early changes occur.
Frequency of glaucoma OCT monitoring
According to the AAO and EGS, the recommended frequency for OCT glaucoma monitoring is:
- High-risk patients: every 6 months
- Stable patients: once a year
- For trend analysis: at least 6–8 scans over 2 years to ensure statistical reliability
Looking ahead, broader use of AI for glaucoma is expected to support earlier and more accurate detection, while also reducing false positives.
Additional tools for monitoring glaucoma treatment
While glaucoma OCT is essential for detecting structural changes, a comprehensive glaucoma assessment requires a multimodal approach. Additional tools include perimetry, tonometry, optic disc fundus photography, and gonioscopy.
Perimetry (visual field testing)
Functional assessment of the optic nerve remains crucial. Standard Automated Perimetry (SAP), most often performed with Humphrey Visual Field Analyzer protocols (24-2, 30-2, 10-2), is the most widely used method.
Key indices:
- MD (mean deviation): average deviation from normal values
- PSD (pattern standard deviation): highlights localised defects
- VFI (visual field index): summarises global visual function; useful for tracking glaucoma progression
- GHT (glaucoma hemifield test): automated analysis of field asymmetry
? Important: In 30–50% of cases, structural changes such as RNFL thinning on OCT precede visual field defects; in others, functional loss appears first. Best practice relies on integrated OCT and perimetry to correlate damage location and monitor glaucoma progression more precisely.
Combined OCT and perimetry remains the gold standard for progression monitoring.
Tonometry
Intraocular pressure (IOP) is the only clearly modifiable risk factor associated with both glaucoma onset and progression.
- Goldmann applanation tonometry remains the gold standard.
- A single IOP reading is insufficient — diurnal fluctuations are an independent risk factor, particularly in normal-tension glaucoma.
Optic disc fundus photography
Although subjective, fundus imaging remains valuable for documenting glaucomatous changes, especially in borderline cases. Unlike OCT, it does not provide quantitative data but helps visualise morphology over time.
What to assess:
- Progressive disc cupping
- Changes in neuroretinal rim shape or colour
- Disc margin haemorrhages (linked to faster RNFL thinning and visual field loss)
- Inter-eye comparisons
Gonioscopy
Gonioscopy evaluates the anterior chamber angle and helps exclude angle-closure, pigmentary, or pseudoexfoliative glaucoma. It also identifies:
- Neovascularisation
- Trabecular meshwork abnormalities
- Other angle anomalies
Patient education: a key to successful glaucoma management
Accurate glaucoma detection and therapy are not enough; adherence to monitoring and treatment is equally critical.
The challenge:
- Early-stage glaucoma is asymptomatic.
- Many patients underestimate its seriousness, leading to poor compliance, missed follow-ups, and discontinuation of therapy.
The goals of patient education:
- Explain that glaucoma progresses silently but can lead to irreversible blindness if untreated.
- Use real-life examples (before/after OCT scans, visual field comparisons) to illustrate progression.
- Teach patients to recognise warning signs (vision changes, eye pain).
- Visualise disease progression with AI tools showing RNFL loss and future risk.
Educational resources may include:
- Printed brochures in patient-friendly language
- Videos featuring OCT images with explanations
- Doctor–patient in-clinic discussions
- Telemedicine platforms with reminders and follow-up prompts
According to the AAO, patients who understand glaucoma are 2.5 times more likely to adhere to treatment and attend check-ups.
Glaucoma OCT: the foundation of long-term glaucoma care
Glaucoma OCT now plays a central role in both diagnosis and monitoring. Its ability to detect subtle structural changes before measurable functional loss makes early intervention possible and increases the chances of preserving vision.
But technology alone is not enough. Accurate interpretation, combined with strong patient education, is essential. When patients understand their disease and the role of glaucoma OCT in treatment, adherence improves and outcomes are better.
OCT is not just a diagnostic device; it is the cornerstone of an integrated glaucoma management strategy, from initial screening to long-term monitoring and treatment optimisation.
Disclaimer: USA FDA 510(k) Class II; Altris Image Management System (Altris IMS); AI/ML models and components intended to use for research purposes only, not for clinical diagnosis purposes.