

Maria Znamenska
Associate Professor of Ophthalmology, Retina Imaging Expert
Reading time
5 min.
Introduction. Overview of Geographic Atrophy (GA) as a Late Stage of Dry AMD
Geographic atrophy (GA) is a chronic progressive retinal degeneration that represents part of the late stage of age-related macular degeneration (AMD). It is characterized by gradual and irreversible atrophy of photoreceptors, the retinal pigment epithelium (RPE), and the choriocapillaris. As a result, a persistent defect of neurosensory tissue develops, which clinically manifests as central vision loss, the appearance of central scotomas, and reduced contrast sensitivity.
Atrophic lesions typically originate in the outer retinal layers and gradually expand, involving the macula and fovea. Over time, this leads to irreversible visual impairment and a significant decline in quality of life. In the early stages, patients may not experience noticeable changes in visual acuity. However, involvement of the central foveal region may lead to a sudden functional deterioration, with patients reporting difficulties in reading, recognizing faces, and working with fine details.
GA is considered one of the leading causes of clinically significant central blindness among people over the age of 60 in developed countries. With the aging population, the prevalence of this condition continues to increase, creating a substantial social and economic burden. In addition to reduced visual acuity, GA significantly affects patients’ quality of life.
Geographic atrophy retina OCT, together with modern digital image analysis algorithms, has become a key tool in the diagnosis, monitoring, and evaluation of OCT biomarkers predicting GA progression. OCT provides cross-sectional imaging of the retina with microscopic resolution, enabling detailed assessment of individual retinal structures—from the inner retinal layers to the RPE–Bruch’s membrane–choriocapillaris complex. This technology has enabled the transition from subjective ophthalmoscopic assessment to objective structural analysis.
The advantages of OCT in the diagnosis and monitoring of GA include its non-invasive nature, high reproducibility, ability to detect early structural changes, and accurate quantitative measurements. Structural alterations at the level of photoreceptors and the RPE often occur long before they become visible on ophthalmoscopy or fundus photography. Proper recognition of OCT biomarkers of GA is essential not only for disease diagnosis but also for personalizing treatment strategies, predicting the risk of progression, and evaluating therapeutic outcomes.
The purpose of this article is to summarize current scientific evidence on OCT biomarkers of geographic atrophy, including their morphological definition, quantitative parameters, prognostic significance, and role in monitoring disease progression. Particular attention will be given to the practical aspects of OCT in clinical practice, interpretation of longitudinal changes, and effective communication with patients regarding the expected course of the disease.
2. Main OCT Biomarkers of Geographic Atrophy
Modern understanding of GA morphology has been largely shaped by the work of international expert groups, particularly the Classification of Atrophy Meetings (CAM) Group. The CAM group proposed standardized terminology and clear OCT-based criteria for retinal atrophy, enabling harmonization of diagnostic approaches in both clinical practice and multicenter studies.
The CAM group recommends spectral-domain OCT (SD-OCT) as the preferred imaging modality for detecting GA-related changes, as it allows identification of the earliest signs of developing atrophy.
2.1 OCT Signs of Geographic Atrophy
The following three features form the basis for the standardized OCT definition of GA:
- Loss of the outer retina
- Loss of the retinal pigment epithelium (RPE) ≥250 µm in diameter
- Choroidal hypertransmission ≥250 µm in diameter
1. Loss of the Outer Retinal Layers
On OCT B-scans this manifests as:
- disruption or loss of the ellipsoid zone (EZ)
- absence of the interdigitation zone
- thinning or complete loss of the outer nuclear layer (ONL)
- thinning (atrophic changes) of the neuroepithelium above the lesion
This feature reflects the loss of photoreceptors, which are the primary functional elements responsible for central vision.
2. Loss of the Retinal Pigment Epithelium (RPE)
The CAM group established a threshold of 250 µm in the largest horizontal dimension to define clinically significant atrophy.
AI detection of RPE atrophy OCT appears as:
- absence or severe thinning of the hyperreflective RPE band
- a well-defined border between preserved and atrophic RPE
3. Choroidal Hypertransmission
Due to the loss of the RPE, light penetrates more deeply into the underlying layers, resulting in increased visualization of the choroid.
On OCT this appears as:
- Increased visibility of the choriocapillaris layer
- Clear correspondence with the area of RPE defect
Classification of Outer Retinal Atrophy Associated with AMD
- Complete RPE and outer retinal atrophy (cRORA)
- Incomplete RPE and outer retinal atrophy (iRORA)
- Complete outer retinal atrophy (cORA)
- Incomplete outer retinal atrophy (iORA)
2.2 OCT Parameters for Monitoring Geographic Atrophy
Once the diagnosis is established, OCT biomarkers predicting GA progression and quantitative monitoring of disease progression becomes critical.
1. Morphological Triad
RPE atrophy, choroidal hypertransmission, and neuroepithelial atrophy represent the hallmarks of complete retinal atrophy.
This triad defines retinal atrophy within the lesion area and allows differentiation between complete and incomplete atrophy using structural criteria.
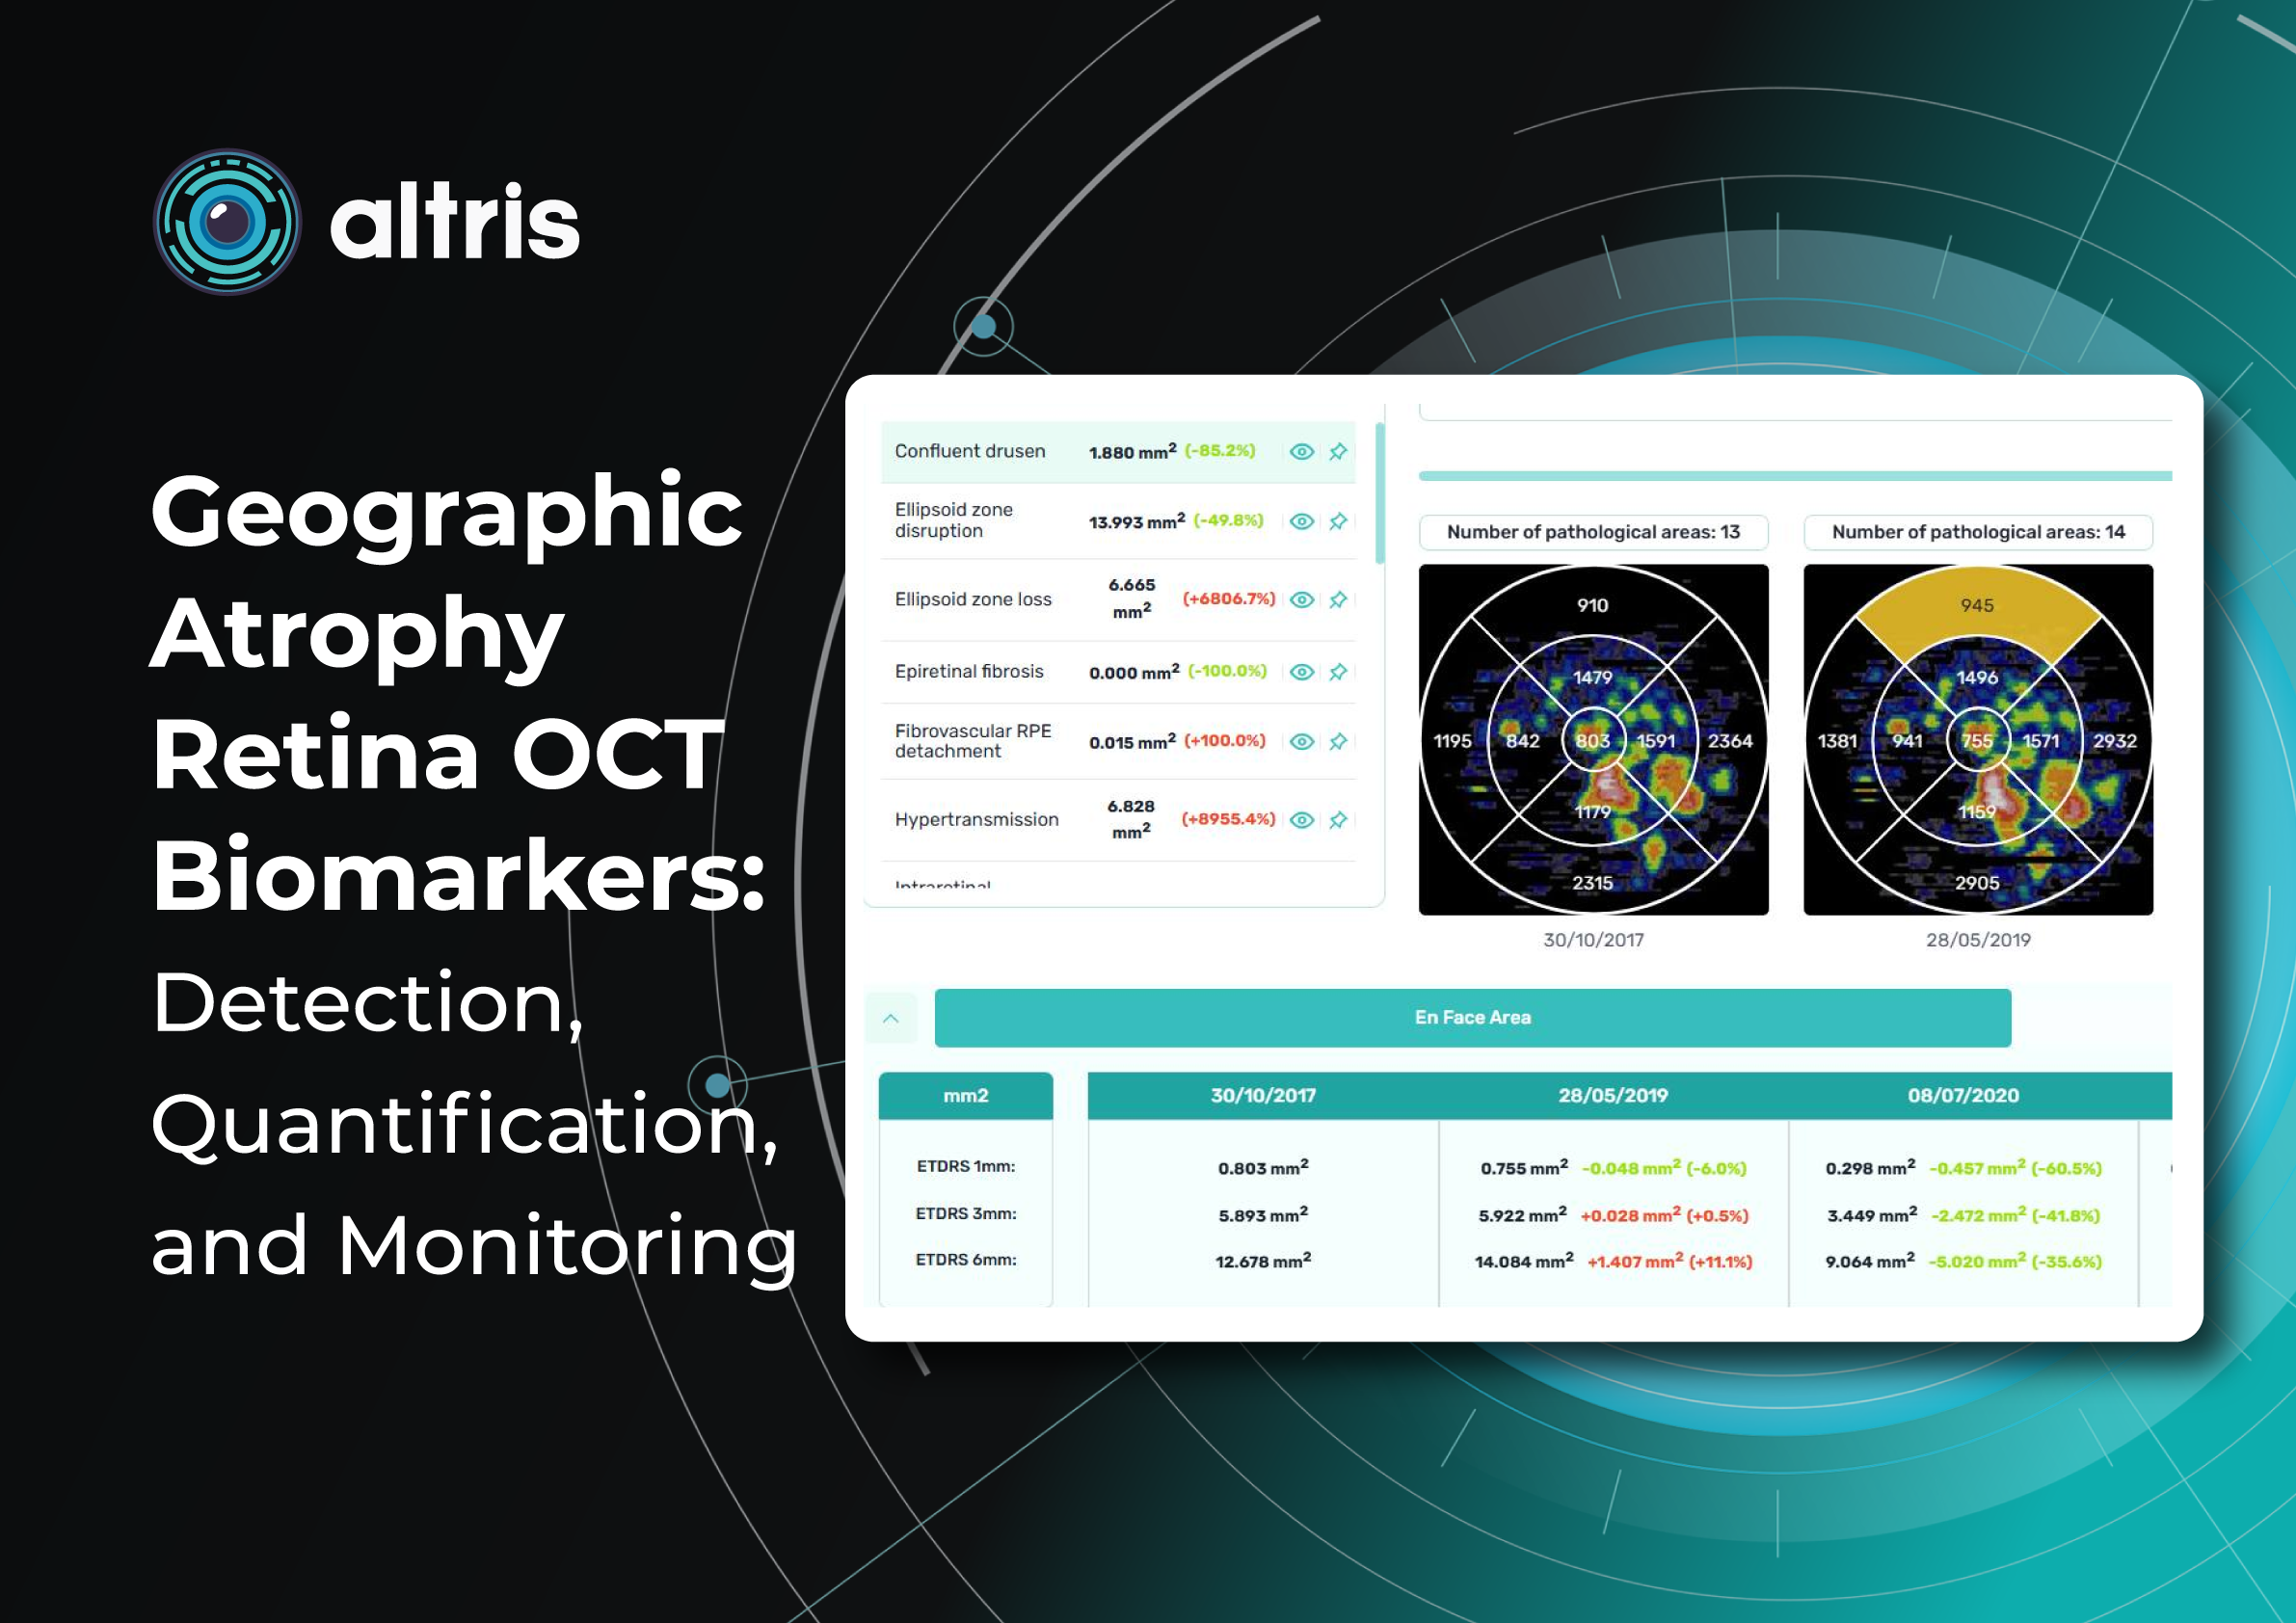
2. Area of Geographic Atrophy (mm²)
Quantitative measurement of GA area is a key parameter in both clinical practice and research.
OCT segmentation enables highly reproducible calculation of the affected area. Modern OCT systems allow:
- automatic segmentation of atrophy boundaries
- calculation of the GA area in mm²
- comparison of measurements between visits
The annual enlargement rate of the GA area is an objective marker of disease progression and correlates with functional visual outcomes. Importantly, the GA area may increase even when visual acuity remains stable.
The area of GA served as the primary endpoint in clinical trials evaluating the intravitreal therapies Syfovre and Izervay, which were recently approved by the FDA as treatments to slow GA lesion growth.
AI-based algorithms further improve the precision and reproducibility of measurements, which is particularly important for long-term monitoring.
Modern OCT systems provide GA area measurements in mm², and comparisons between visits provide an objective measure of disease dynamics. Even when patients do not perceive changes, increasing lesion area confirms disease progression.
3. Distance Between GA Lesions and the Fovea
An important quantitative parameter is the distance between the foveal center and the nearest border of the atrophic lesion.
This parameter has direct functional significance. Decreasing distance over time correlates with declining visual function: the closer GA approaches the fovea, the higher the risk of sudden vision loss.
Patients with GA lesions approaching the fovea have a poorer prognosis and often require more intensive monitoring and therapeutic interventions.
This parameter also allows objective risk prediction and supports:
- early referral to specialized ophthalmology centers
- discussion of potential vision loss with patients
2.3 Predictors of GA Development and Progression
GA frequently develops as a consequence of drusen involution or structural alterations of the RPE.
GA lesions in AMD may arise in association with:
- certain drusen types (large or confluent drusen, reticular pseudodrusen)
- previous choroidal neovascularization
- RPE detachment or RPE tear
- refractile deposits
- vitelliform lesions
Geographic Atrophy as a Result of Drusen Involution
Drusen are localized accumulations of pathological material (photoreceptor metabolic by-products) between the RPE and Bruch’s membrane. They may change in number, size, and morphology.
Regression or disappearance of drusen, as well as structural changes observed on OCT, represent predictors of progression to GA. Regular monitoring allows early detection of potentially dangerous changes.
Types of Drusen
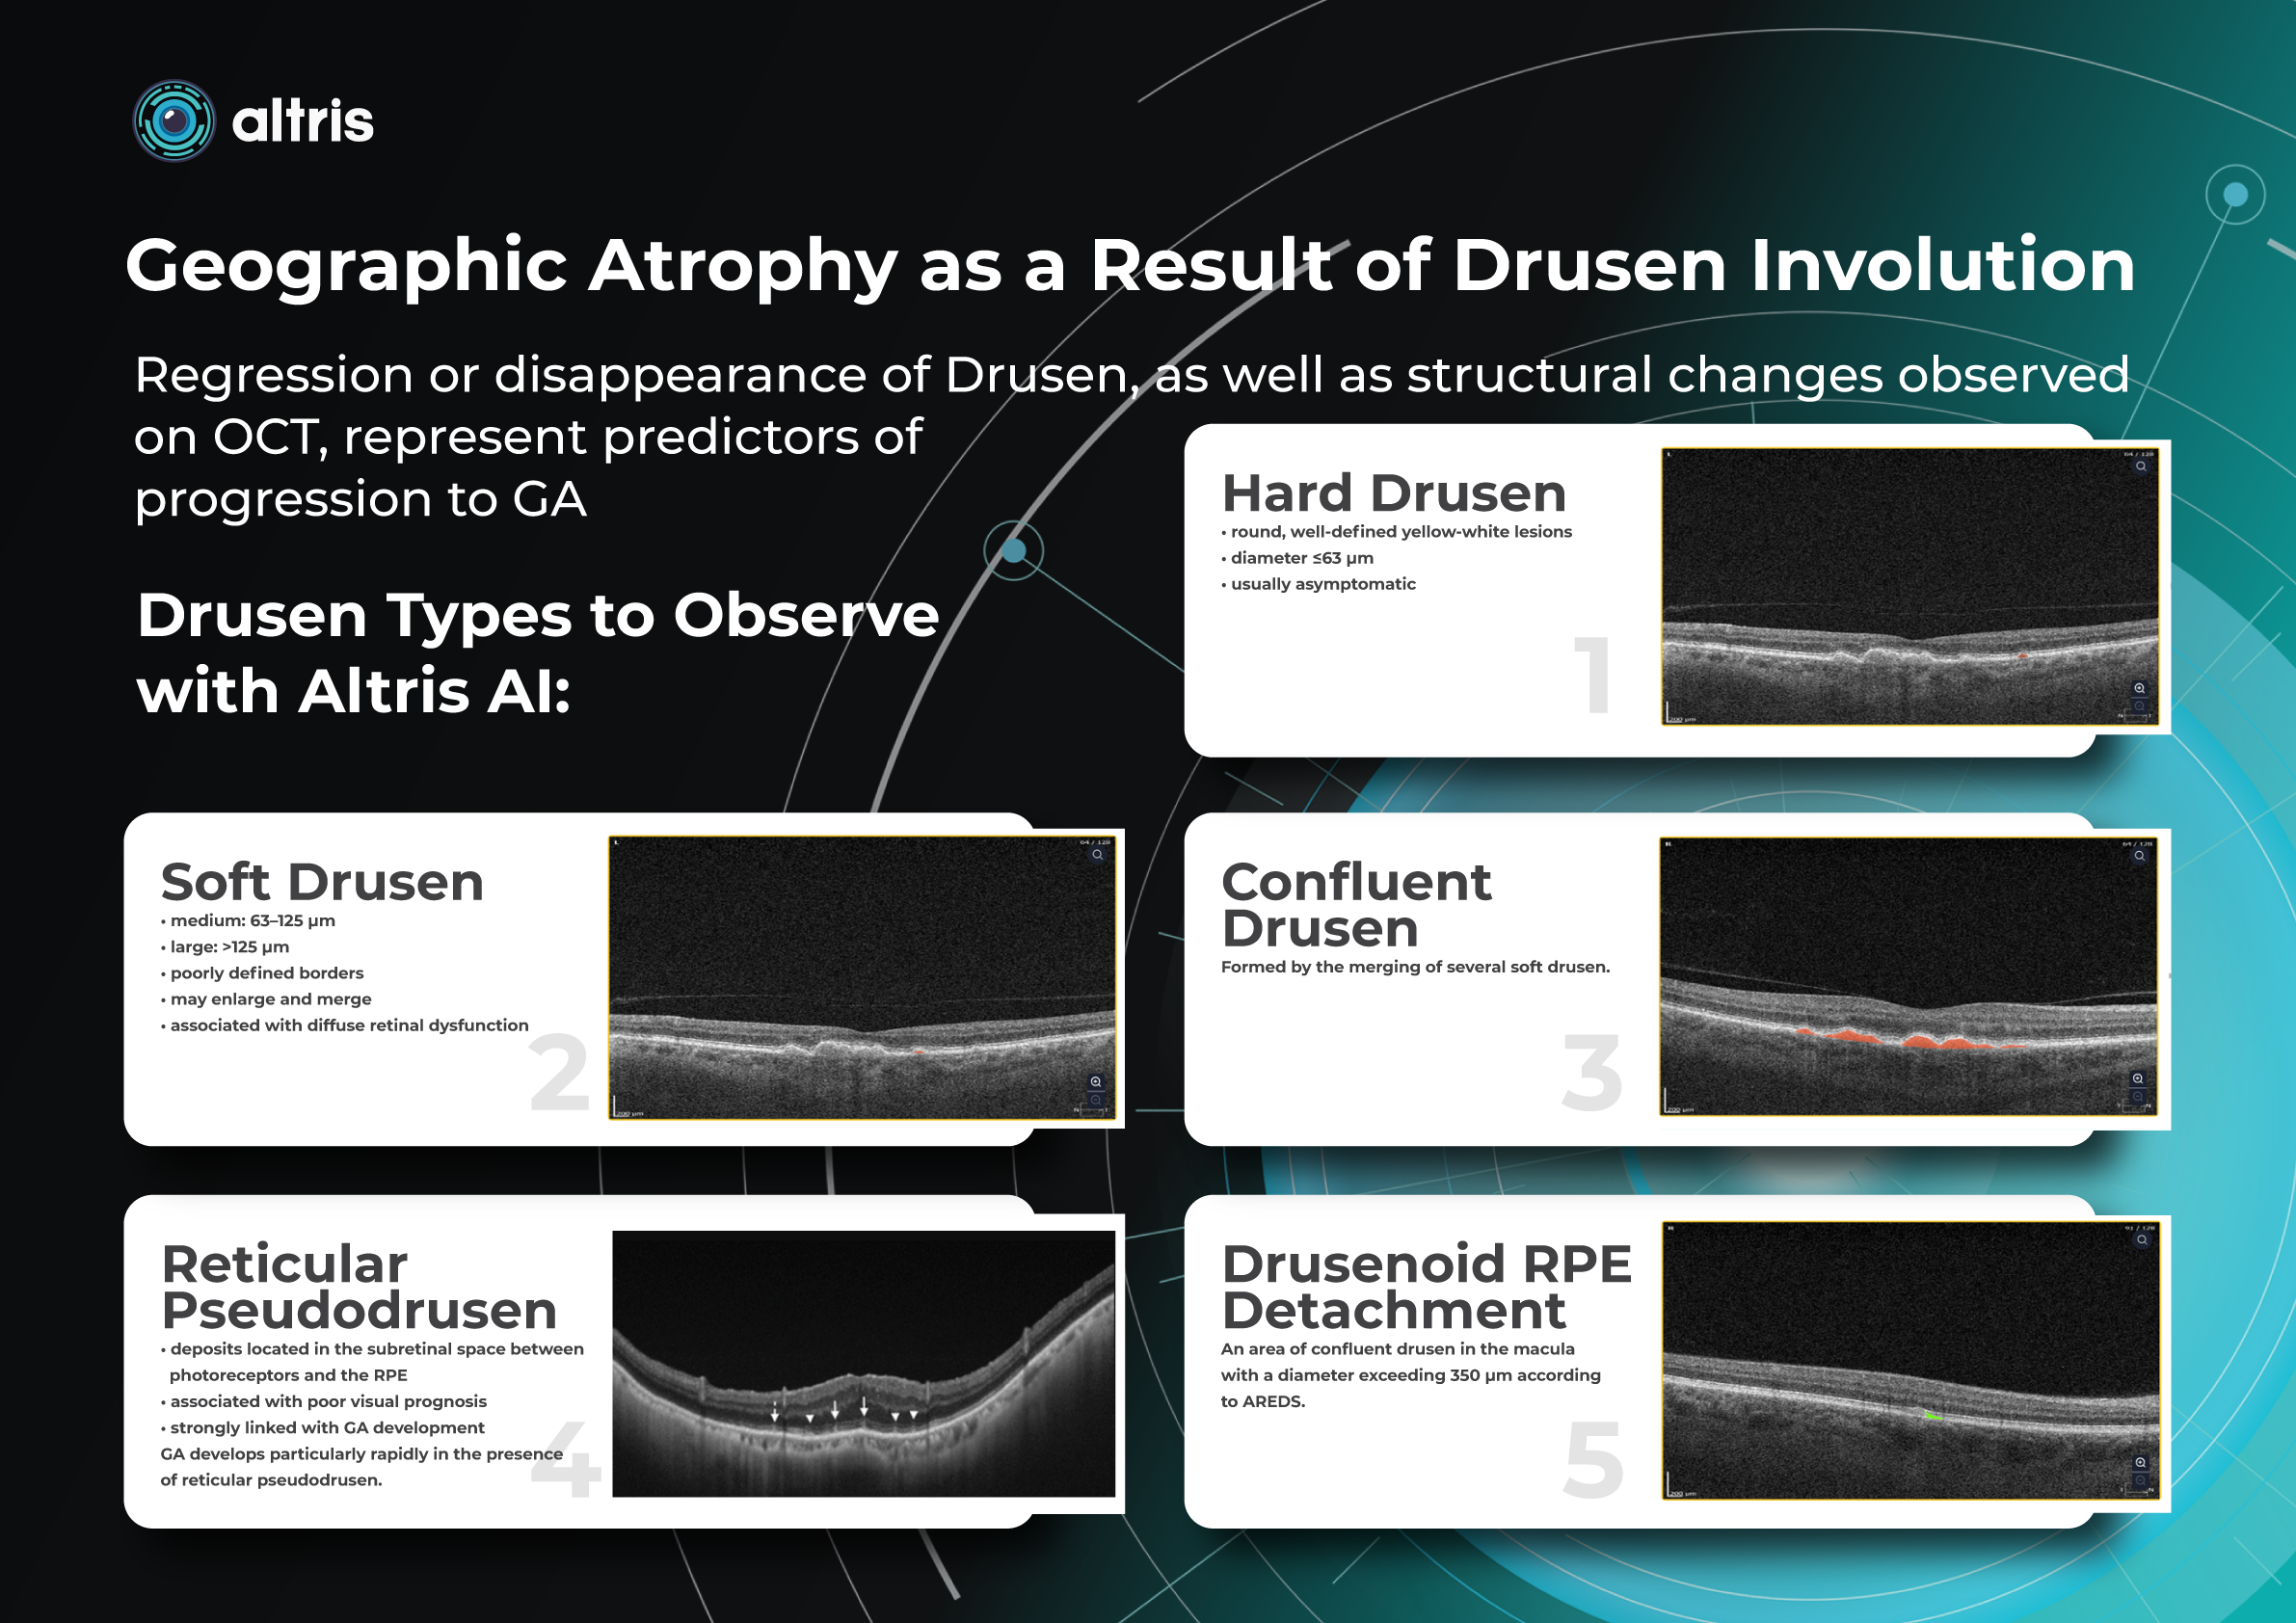
1. Hard Drusen
- round, well-defined yellow-white lesions
- diameter ≤63 µm
- usually asymptomatic
2. Soft Drusen
- medium: 63–125 µm
- large: >125 µm
- poorly defined borders
- may enlarge and merge
- associated with diffuse retinal dysfunction
3. Confluent Drusen
Formed by the merging of several soft drusen.
4. Drusenoid RPE Detachment
An area of confluent drusen in the macula with a diameter exceeding 350 µm according to AREDS.
5. Cuticular Drusen
- located between the RPE and Bruch’s membrane
- small in diameter but numerous
- often confluent
- steep, sloping sides (“saw-tooth” appearance)
- may disrupt RPE structure
- represent a risk factor for progression to GA
6. Reticular Pseudodrusen
- deposits located in the subretinal space between photoreceptors and the RPE
- associated with poor visual prognosis
- strongly linked with GA development
GA develops particularly rapidly in the presence of reticular pseudodrusen.
Predictors of GA Development in Eyes with Drusen
- large numbers of drusen, particularly in the central macula
- regression of drusen
- structural changes such as heterogeneous internal reflectivity
These predictors help identify patients at high risk for GA development and are valuable for optimizing monitoring intervals and potential preventive strategies.
Another predictor of faster GA lesion formation is hyperreflective foci. These are small intraretinal hyperreflective dots, often located above drusen and typically associated with local disruption of the RPE structure. They likely represent migrating RPE cells and activated microglia. A tiny blue spot is a hyperreflective foci area detected by Altris automated GA segmentation OCT:
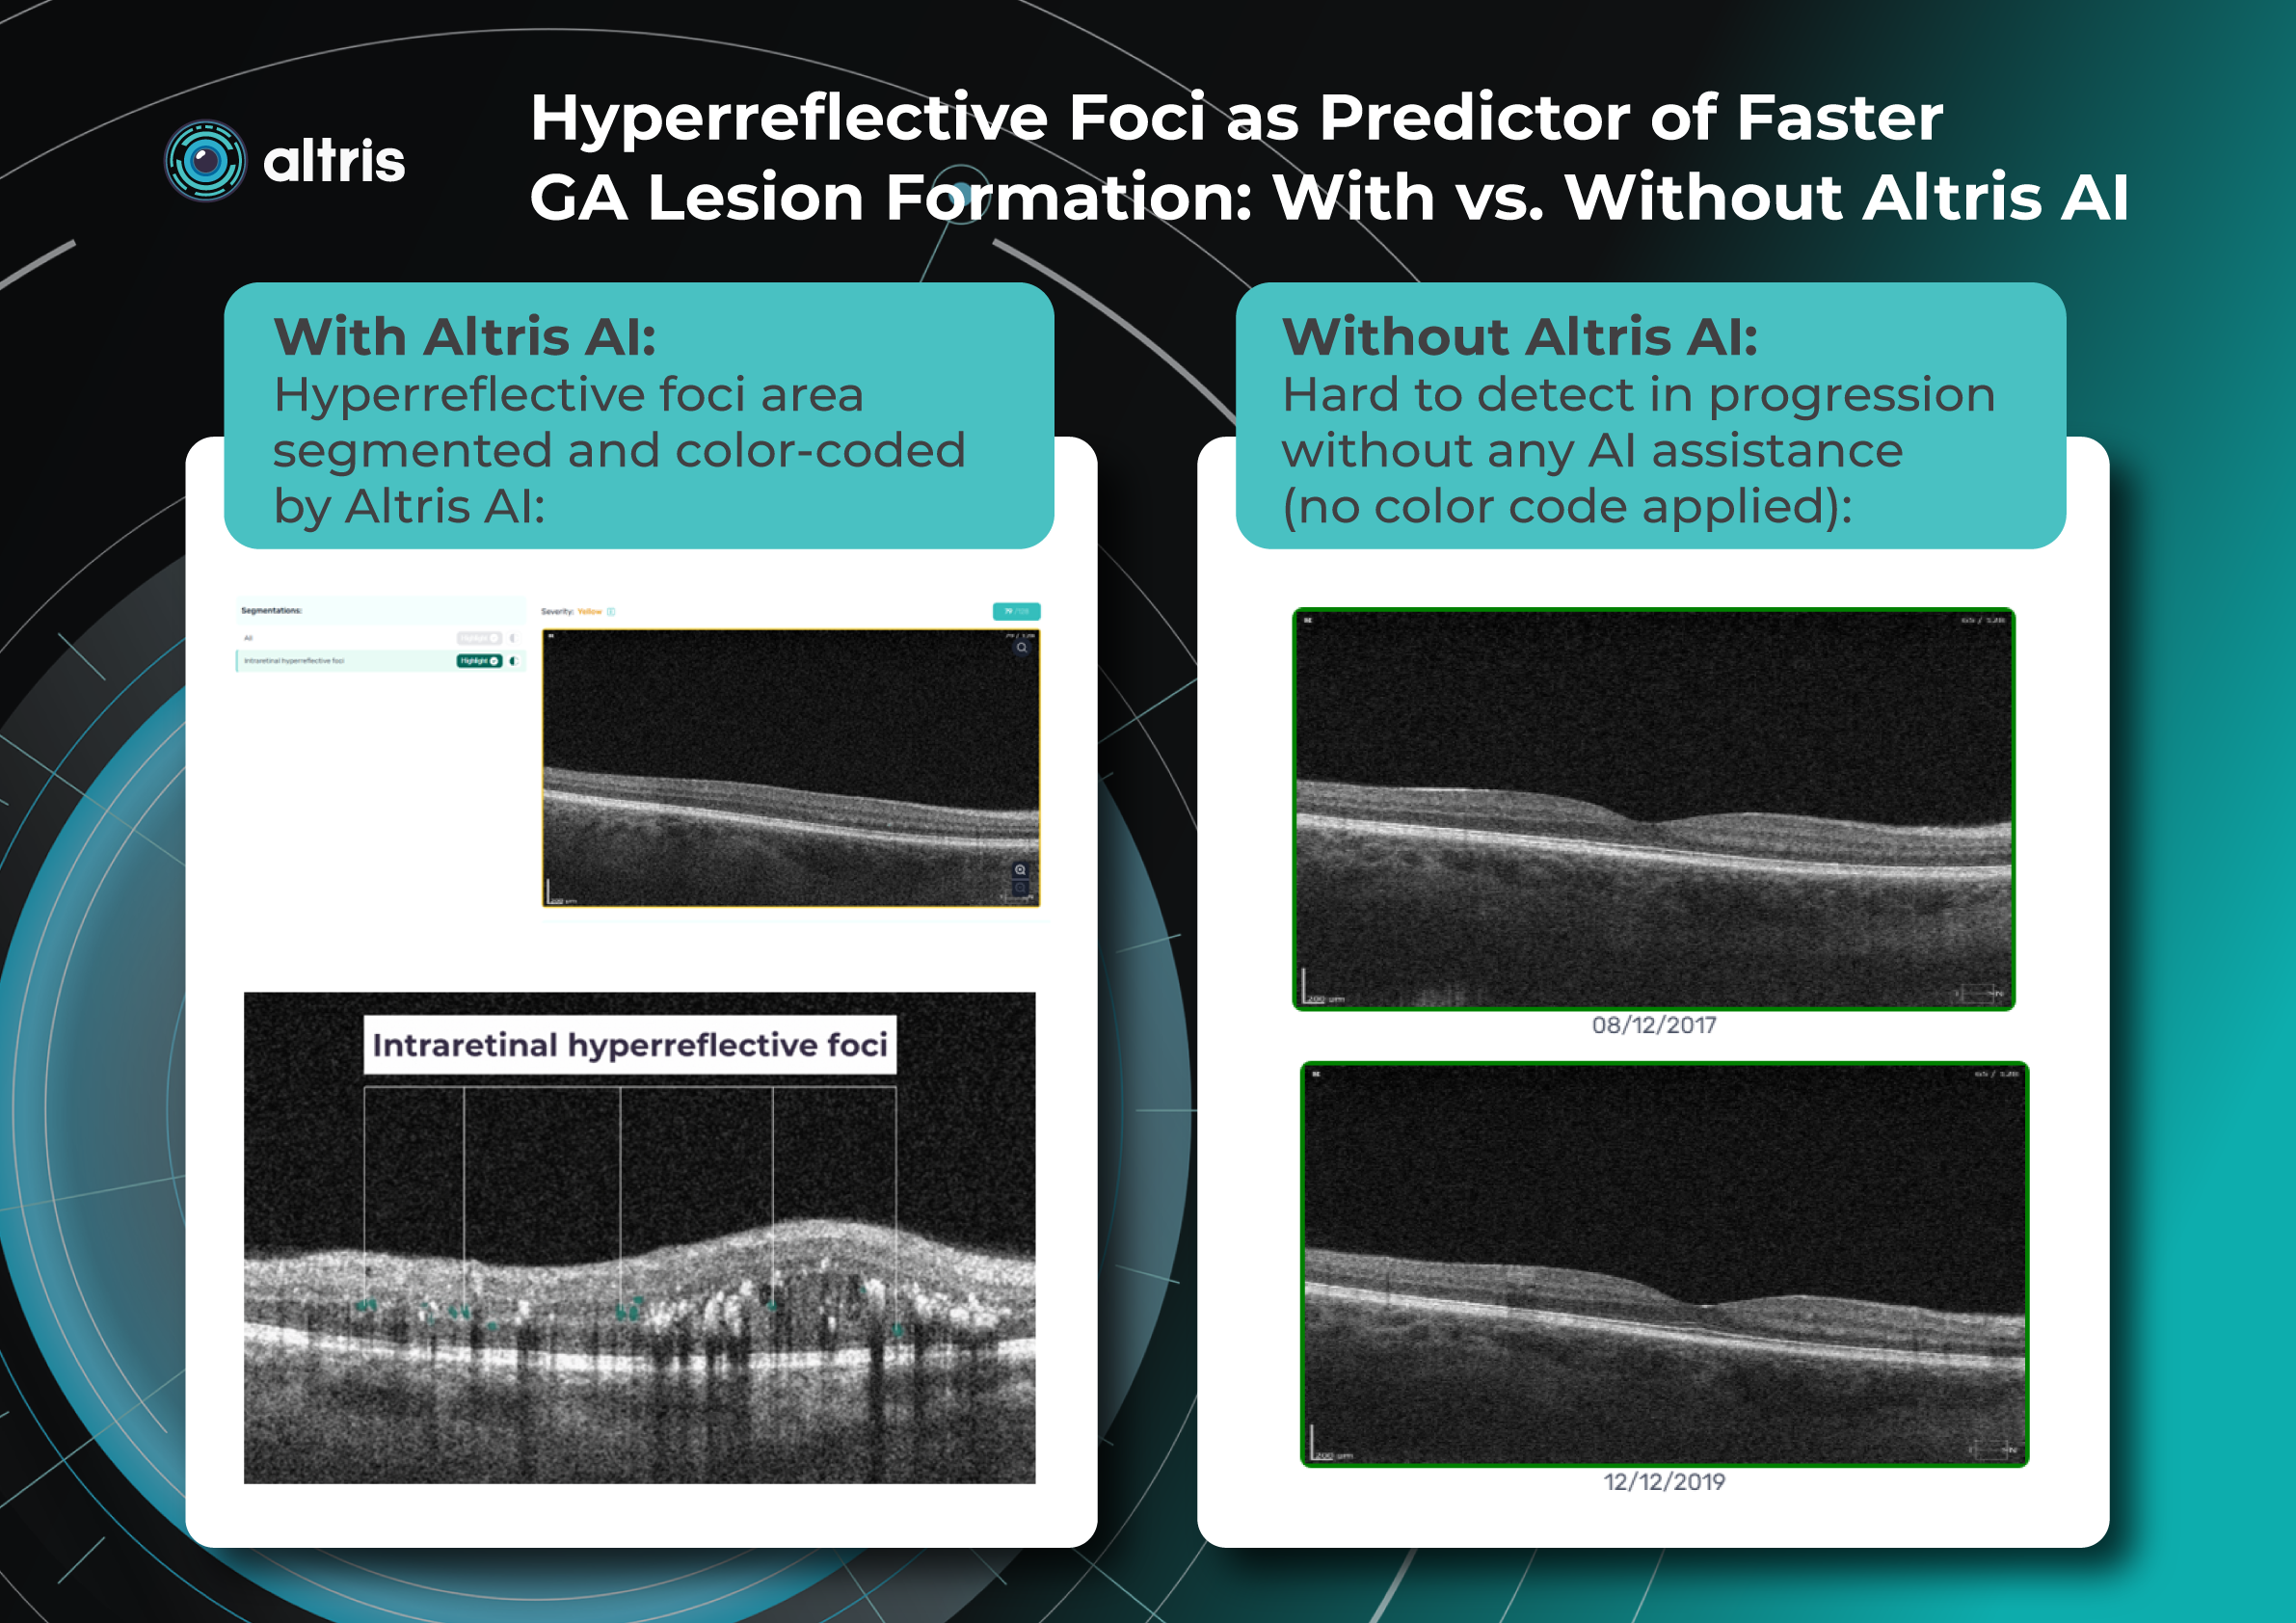
Their presence significantly increases the risk of GA development within the next few years (in some studies up to five-fold within two years).
Clinical Importance of Predictors
Identifying high-risk patients allows clinicians to:
- individualize OCT monitoring frequency
- initiate treatment earlier
- predict functional vision loss
- discuss expected disease progression with patients in a timely manner.
Management of Geographic Atrophy and Patient Education
Management of patients with GA today extends far beyond simple observation. It involves an active, structured strategy that combines regular OCT monitoring, timely initiation of therapy, risk-factor modification, and comprehensive patient education.
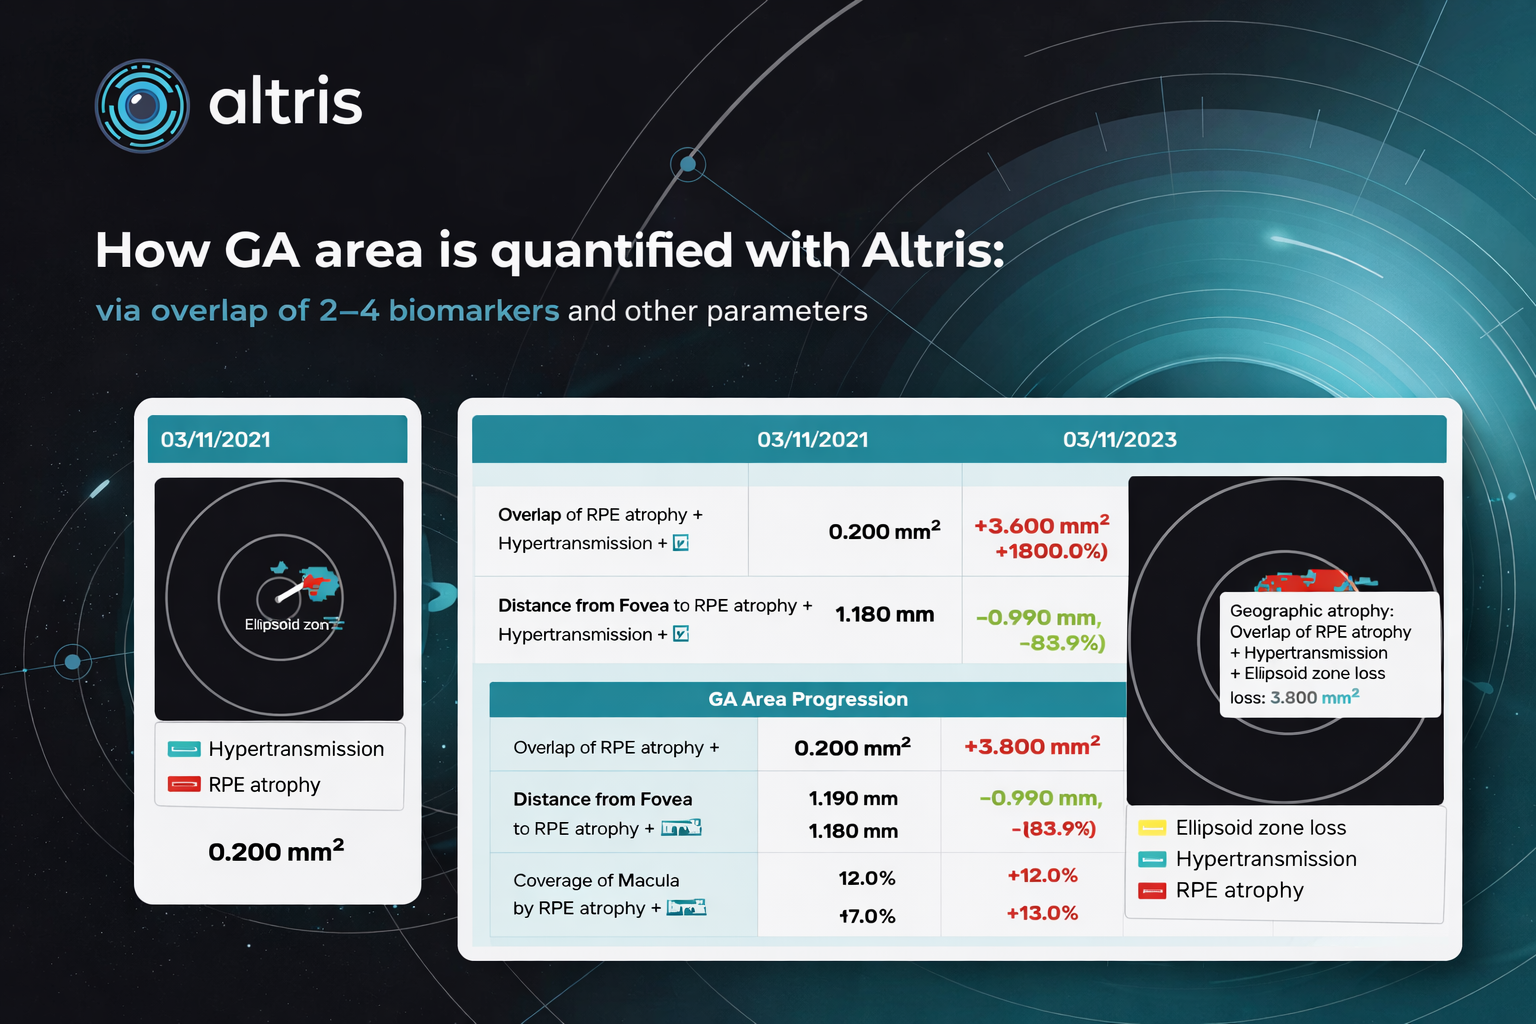
The main goal is to slow disease progression and reduce the rate of atrophy expansion while preserving the central fovea for as long as possible. GA Progression quantified via Altris:
The Role of OCT
Effective GA management is impossible without high-quality OCT monitoring.
OCT enables clinicians to:
- quantify the area of atrophy
- determine the rate of lesion expansion
- measure the distance to the fovea
- analyze outer retinal layer integrity
- identify predictors of rapid progression
Monitoring is recommended every 3–6 months, and when intravitreal therapy is used, OCT should be performed before each injection to assess disease activity and lesion growth rate.
OCT also serves as a powerful motivational tool: showing patients the dynamics of structural changes helps them better understand the need for treatment and regular follow-up visits.
Patients should be informed that GA may progress without sudden visual deterioration. Structural OCT changes often precede functional vision loss, making regular examinations essential even when visual acuity appears stable.
Current Treatment Options
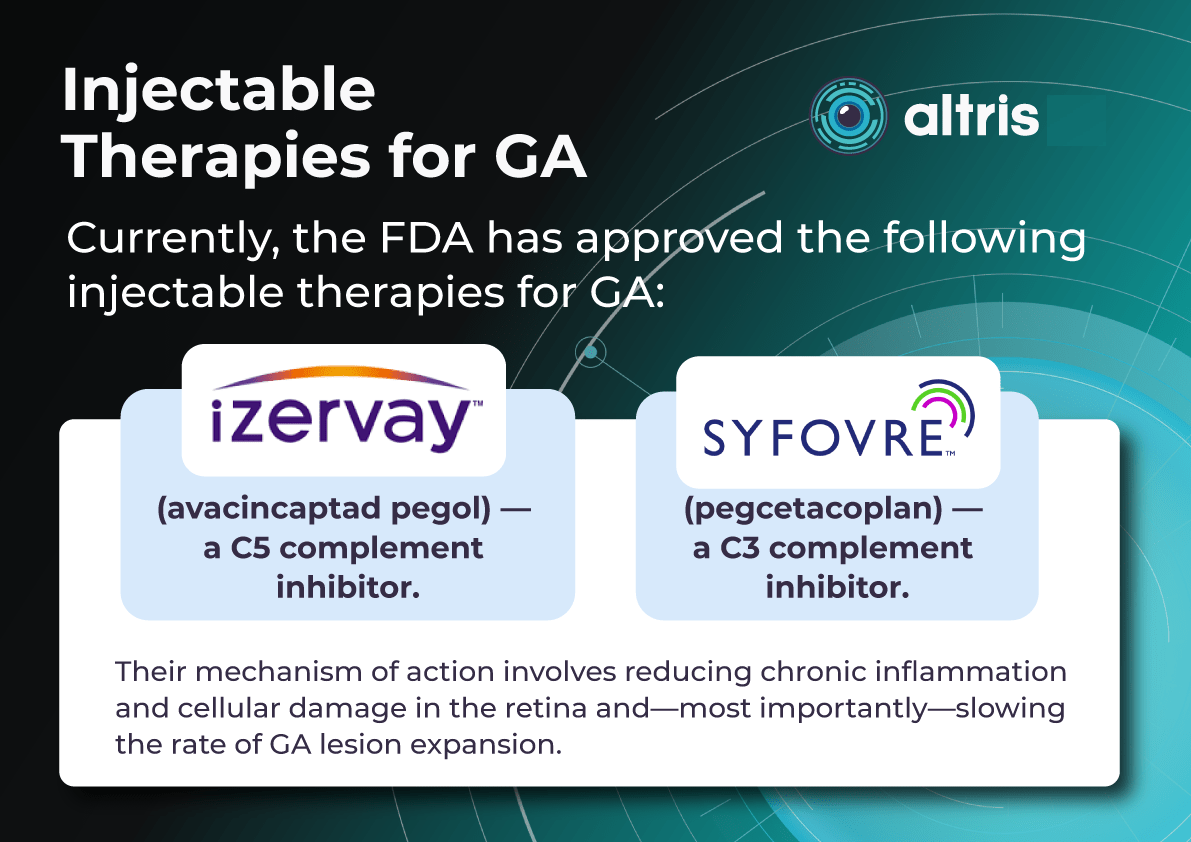
Intravitreal Therapy
- Izervay (avacincaptad pegol)
- Syfovre (pegcetacoplan)
For the first time in decades, FDA-approved treatments are available that slow the expansion rate of GA lesions. Although they do not restore lost vision, slowing visual decline is an important clinical goal.
Patients should clearly understand that treatment slows progression but does not restore vision. Proper expectation management improves treatment adherence and reduces disappointment.
Nutritional Supplements
Formulations based on AREDS / AREDS2 have been shown to reduce the risk of progression from intermediate AMD to advanced stages.
Patients should be informed that these supplements do not treat GA, but may have preventive value at earlier stages.
What Patients Must Understand
1. Progressive Nature of GA
GA is a chronic progressive disease. The area of atrophy almost always increases over time. The rate of progression varies depending on morphological characteristics.
Patients should understand that treatment aims to slow, not completely stop, disease progression.
2. Importance of Lifestyle
Although lifestyle modification has limited influence once GA is established, recommendations remain relevant:
- smoking cessation
- blood pressure and lipid control
- antioxidant-rich diet and omega-3 fatty acids
- regular physical activity
These factors improve overall vascular health and may reduce systemic inflammation.
3. Psychological Adaptation
Progressive central vision loss often leads to anxiety, fear of blindness, and reduced social activity.
It is important to discuss:
- low-vision aids (magnifiers, telescopic glasses, electronic magnifiers)
- support resources for people with low vision
Psychological support significantly improves adaptation and quality of life.
Patient Partnership: The Foundation of Success
Modern management of dry AMD is no longer hopeless. With approved therapies and evidence-based preventive strategies, clinicians can meaningfully influence the rate of disease progression.
However, the effectiveness of any strategy depends on collaboration between the physician and the patient.
Patient education regarding:
- the nature of the disease
- the role of regular OCT monitoring
- treatment possibilities and limitations
- the importance of lifestyle modification
is an essential component of modern GA management.
FAQs
Which OCT biomarkers are predictive of GA progression to look for?
Key biomarkers include hypertransmission defects, RPE atrophy, photoreceptor loss, ellipsoid zone disruption, hyperreflective foci, and reticular pseudodrusen. These structural changes are strongly associated with GA development and progression in AMD.
How does AI OCT help prioritize patients at risk of GA progression?
AI for GA systems identifies high-risk biomarkers and calculates progression rates, enabling clinicians to triage patients for closer monitoring or treatment.
Can AI detect multiple retinal pathologies in addition to GA?
Many platforms detect 70+ retinal pathologies and biomarkers simultaneously on OCT scans. Altris AI detects and quantifies 40+ retina biomarkers and 40+ pathologies.
How can AI quantify geographic atrophy on OCT scans?
AI algorithms automatically segment GA lesions and calculate lesion area, retinal layer loss, and biomarker overlap, providing objective measurements in millimeters or percentages.
Can AI OCT support treatment decisions for GA therapies?
AI can measure structural parameters such as EZ loss or RPE integrity, which may help evaluate treatment response or disease activity. Altris applies Flags to filter out the eligible patients then.
Can AI detect early GA before it becomes clinically visible?
Yes. AI models can identify subtle structural abnormalities on OCT, such as EZ disruption or early hypertransmission, enabling earlier detection of atrophy.
Which OCT metrics should be monitored to track GA progression?
Clinically relevant metrics include: GA lesion area (mm²), rate of lesion growth, distance from lesion margin to the fovea, percentage of macular involvement. AI can automatically calculate and track these parameters over time.
How to efficiently measure geographic atrophy on OCT?
To efficiently measure Geographic Atrophy on Optical Coherence Tomography (OCT), clinicians should identify key biomarkers such as RPE loss, outer retinal thinning, and choroidal hypertransmission, then quantify the atrophy area (mm²) using en-face OCT or automated segmentation tools. Tracking lesion size and its distance to the fovea over time allows accurate monitoring of disease progression. AI-assisted OCT platforms can automate detection and measurements, making longitudinal assessment faster and more consistent.
References
- Guymer RH, Rosenfeld PJ, Curcio CA, et al.
Incomplete retinal pigment epithelium and outer retinal atrophy in age-related macular degeneration: Classification of Atrophy Meeting report.
Ophthalmology.
Available at: https://pubmed.ncbi.nlm.nih.gov/38387826/ - Natural history and progression of geographic atrophy in AMD.
ScienceDirect.
Available at: https://www.sciencedirect.com/science/article/pii/S2468653023006681 - OCT Spotlight: Characterizing Geographic Atrophy Development and Progression.
Retina Today.
Available at: https://retinatoday.com/articles/2025-apr/oct-spotlight-characterizing-ga-development-and-progression - Automated monitoring of geographic atrophy using OCT imaging.
Scientific Reports.
Available at: https://www.nature.com/articles/s41598-023-34139-2 - Classification of Atrophy Meeting (CAM) consensus for OCT-based atrophy classification in AMD.
American Academy of Ophthalmology Journal.
Available at: https://www.aaojournal.org/article/S0161-6420(17)31703-7/abstract - Identifying Geographic Atrophy Biomarkers.
Optometric Management.
Available at: https://www.optometricmanagement.com/issues/2025/october/identifying-geographic-atrophy-biomarkers/ - FDA Approval Announcement for Izervay (avacincaptad pegol).
Astellas Pharma Newsroom.
Available at:
https://newsroom.astellas.com/2023-08-05-Iveric-Bio-Receives-U-S-FDA-Approval-for-IZERVAY-TM-avacincaptad-pegol-intravitreal-solution-,-a-New-Treatment-for-Geographic-Atrophy