Altris IMS for OCT Optometry Research


Maria Znamenska, Retina Expert, PhD Ophthalmology, Altris IMS Medical Director
My name is Maria Znamenska, I am an ophthalmologist, a PhD in ophthalmology, and the Medical Director of Altris IMS. I have been practicing and teaching OCT for more than 16 years and was involved in numerous ophthalmic reserach projects. We created our system to:
Power your research on 40+ retinal biomarkers in relation to 30+ retina conditions
Quantify and analyze 40+ retinal biomarkers relevant to reserach of 30+ retinal conditions
Explore 40+ retinal biomarkers studied across major retinal research areas (Dry & Wet AMD, GA, DR, DME, RVO).
Generate aggregated, non-diagnostic analytics based on 40+ retinal biomarkers across research datasets.
As of today, Altris IMS is intended for Research Use Only (RUO) and is not intended for diagnostic purposes.
Researchers on Altris IMS
Altris IMS workflow for Research Use in Optometry
14 Days of Free Trial to everyone who is ready to try
Free Trial Using Altris IMS OCT workflow for GA, DR, wet AMD Research
-


Altris IMS provides tools to visualize, quantify, and monitor over 30 retinal pathologies and more than 40 retinal biomarkers on OCT images for research and structured image review purposes.
-
Each retinal biomarker and pathology can be quantified in terms of area and volume to support research and structured analysis of OCT data.
-

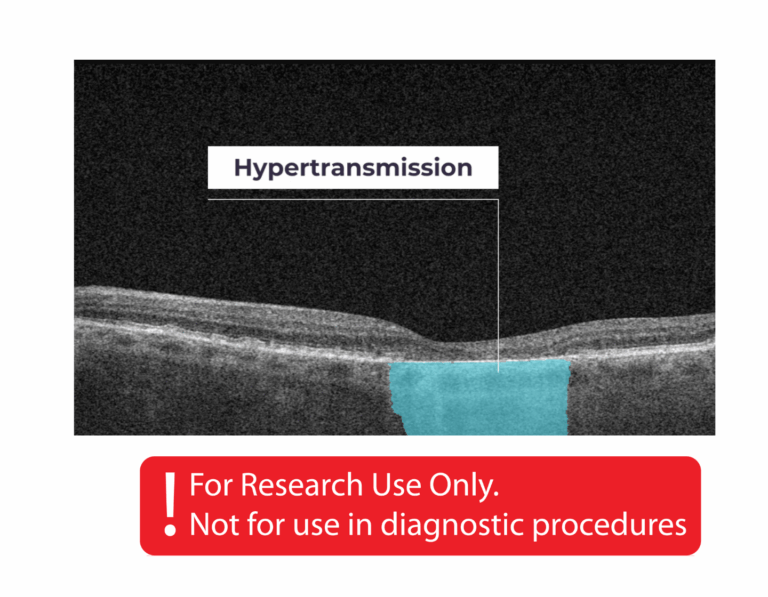
Researchers analyzing Geographic Atrophy (GA) can visualize GA-related features by examining the overlap of hypertransmission, RPE disruption, and neurosensory retina atrophy in OCT images.


CHOOSE A PATIENT JOURNEY

OCT workflow for Researchers
Geographic atrophy (GA) is characterized by progressive changes in the macula and is associated with late-stage age-related macular degeneration (AMD), as described in research studies
See how Altris IMS supports structured analysis of OCT scans containing features associated with Geographic Atrophy (GA) for research and visualization purposes
-

The platform provides tools to analyze retinal features associated with Geographic Atrophy (GA) individually. It also includes functionality to calculate the combined GA area and visualize changes in these features across multiple OCT examinations for research and review purposes.
-
Hypertransmission is an observable feature in retinal OCT images associated with diabetic retinopathy (DR), which can be visualized using Altris IMS for research and structured image review purposes.
-
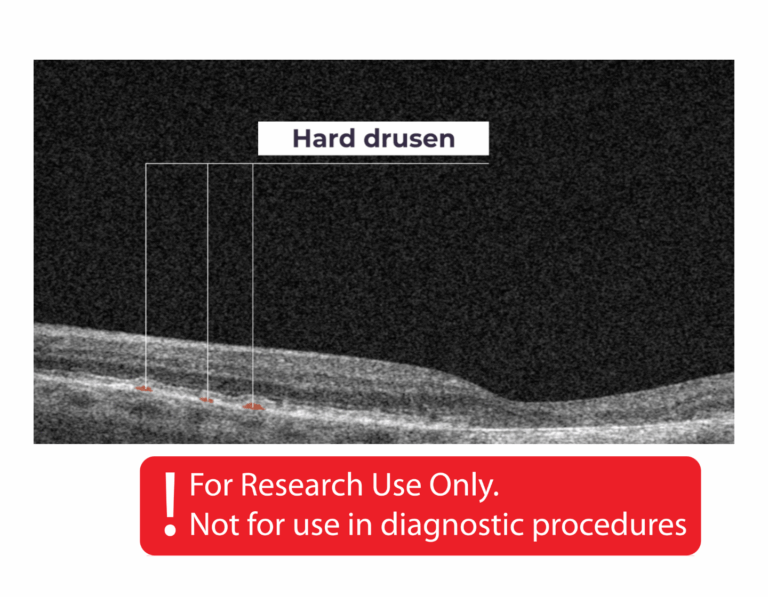
Hard drusen are small, round, well-defined deposits in the retina, typically measuring less than 63 microns in diameter, as described in research studies.
-
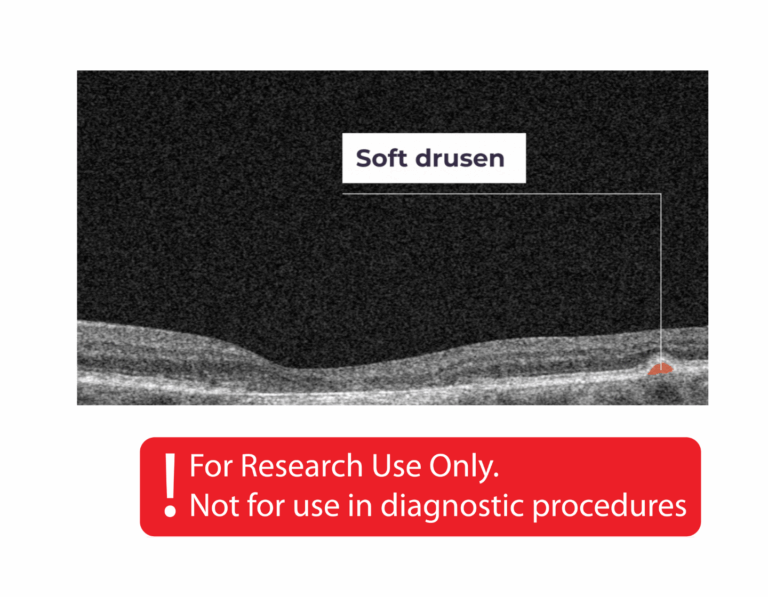
Soft drusen are deposits observed in OCT images, often concentrated in the central macula and gradually decreasing toward the peripheral retina, as described in research studies.
-
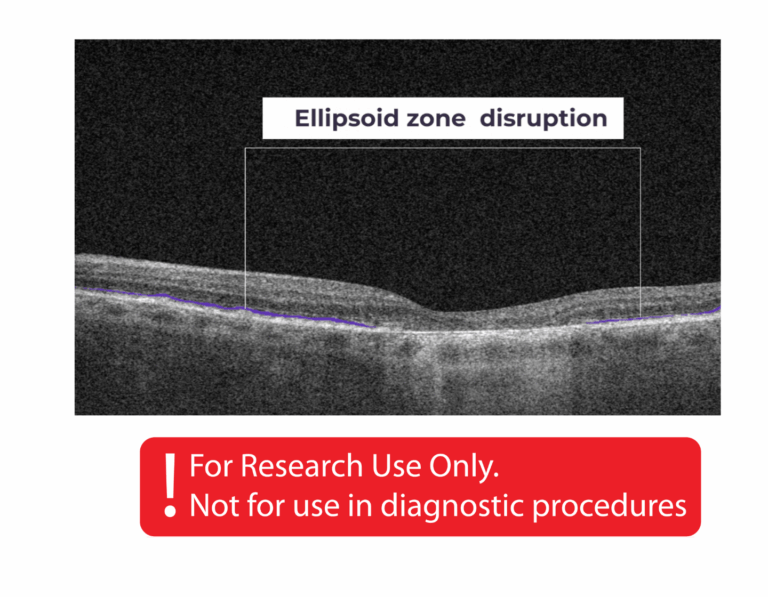
Ellipsoid zone disruption refers to alterations or defects in the photoreceptor layer, observed as changes in the ellipsoid zone (EZ) in OCT images, as described in research studies.
-
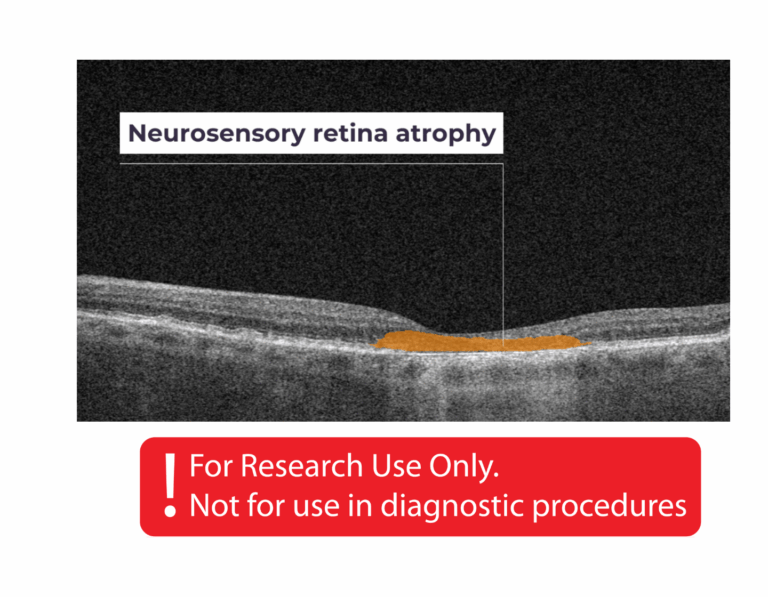
Neurosensory retina atrophy refers to thinning and loss of retinal layers, as observed in OCT images and described in research studies.
-
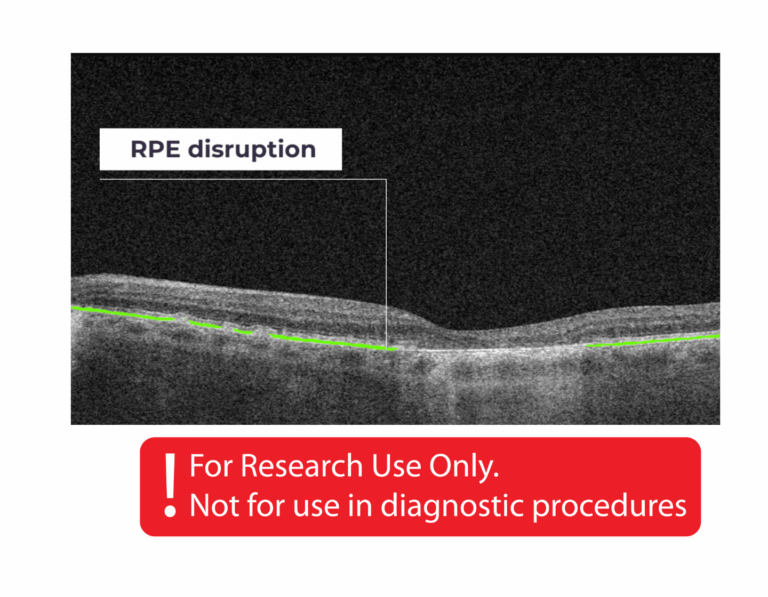
RPE disruption. Elevation of the Retinal Pigment Epithelium layer, as described in research studies.
-
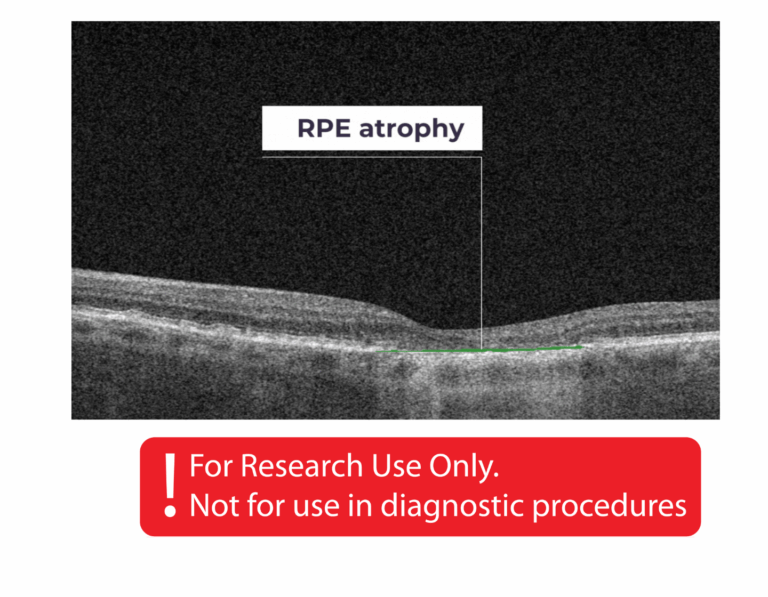
RPE atrophy refers to areas of pigment loss in the retinal pigment epithelium (RPE), observed in OCT images and involving regions between the temporal retinal vascular arcades, as described in research studies.

OCT workflow for the patient with DR
Diabetic retinopathy (DR) is a retinal microvascular condition associated with diabetes mellitus, described in research studies for its effects on retinal structure
Altris IMS provides tools to visualize and analyze OCT images with features associated with DR for research and structured image review purposes
-

Hard exudates are deposits in the retina composed of lipid and protein-based material, including fibrinogen and albumin, as described in research studies.
-
Diffuse edema is observed in OCT images as thickened areas of lower reflectivity in the outer retina, without the presence of cystoid spaces, as described in research studies.
-
Intraretinal hyperreflective foci are typically dot-like or round features observed throughout the retinal layers and choroid in OCT images, as described in research studies.
-
Intraretinal cystoid fluid refers to fluid within the retina that appears as cystic cavities in OCT images, as described in research studies.
OCT workflow for Wet AMD Research
Wet AMD is a form of age-related macular degeneration in which abnormal blood vessels may develop in the macula, as described in research studies
-
Ellipsoid zone disruption refers to alterations or defects in the photoreceptor layer, observed as changes in the ellipsoid zone (EZ) in OCT images, as described in research studies.
-
RPE Disruption is the disruption of the Retinal Pigment Epithelium layer, as described in research studies.
-
Subretinal fluid refers to the accumulation of clear or lipid-rich material in the subretinal space—between the neurosensory retina (NSR) and the underlying retinal pigment epithelium (RPE)—as observed in OCT images and described in research studies.
-
Fibrovascular RPE detachment refers to a separation of the retinal pigment epithelium (RPE), associated with the presence of sub-RPE structures such as fibrovascular membranes, as observed in OCT images and described in research studies.
-
Subretinal hyperreflective material (SHRM) refers to hyperreflective features located between the retina and the retinal pigment epithelium (RPE), as observed in OCT images and described in research studies.
OCT workflow for analysis of retinal features associated with glaucoma in research or image review contexts
-
Ganglion Cell Complex (GCC) asymmetry analysis provides visualization and quantification of retinal features across hemispheres, which can be used in research studies exploring early glaucoma–related changes.
-
Based on the level of asymmetry glaucoma risk is defined as low, medium or high, for research purposes only.
-
For more detailed analysis, an 8×8 grid is overlaid on the 6×6 mm macular area. Asymmetry analysis provides a comparison of corresponding grid regions between the two hemispheres to support research-based evaluation of retinal features.
-
Advanced Optic Disc Analysis quantifies key optic disc parameters, including disc area, cup area, cup volume, cup depth, cup/disc area ratio, and rim absence angle. The module provides standardized outputs to support structured review and research-based analysis of optic disc features in OCT images.

Reach full experience using Altris IMS for OCT
Book a demo Power your research on 40+ retinal biomarkers in relation to 30+ retina conditions
Quantify and analyze 40+ retinal biomarkers relevant to reserach of 30+ retinal conditions
Explore 40+ retinal biomarkers studied across major retinal research areas (Dry & Wet AMD, GA, DR, DME, RVO).
Altris IMS provides tools to visualize and quantify over 40 retinal biomarkers across more than 30 retina-related features in OCT images for research and structured image review purposes.