

Maria Znamenska
Ophthalmologist
Reading time
5 min
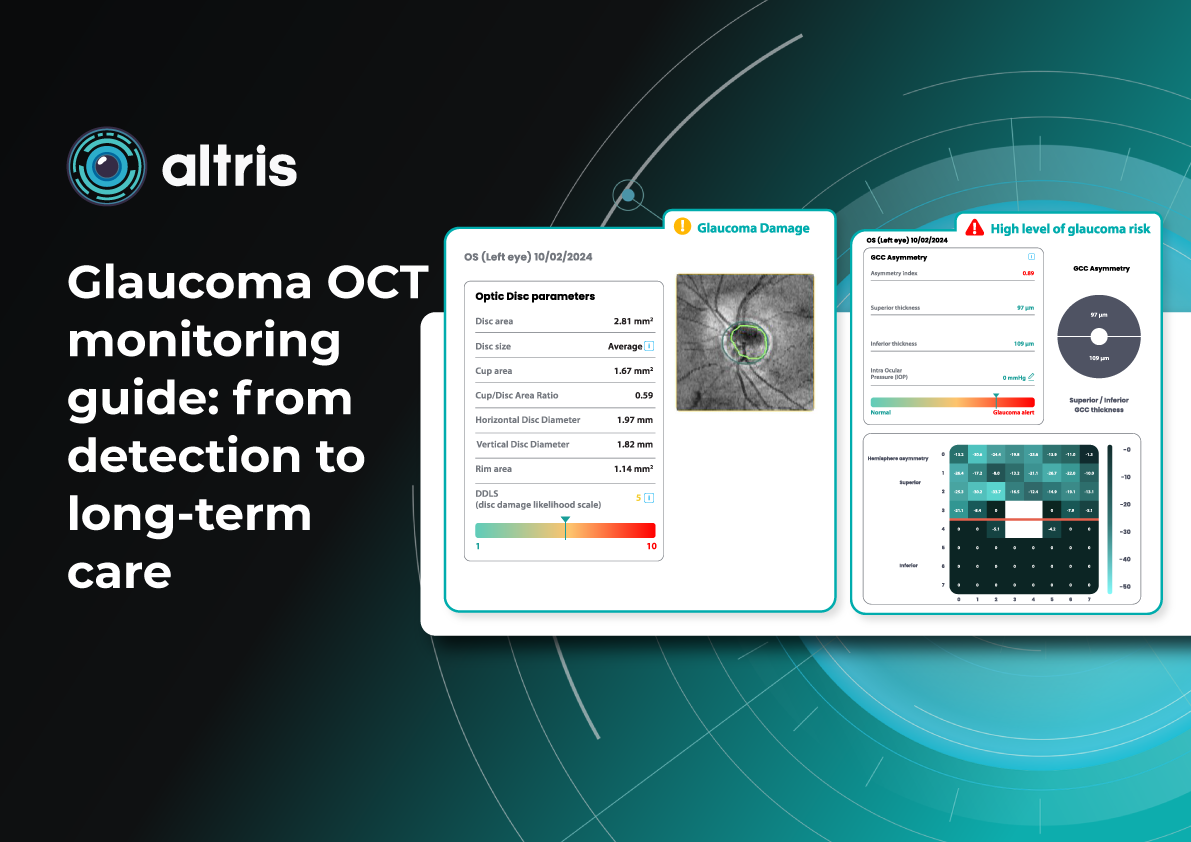
Glaucoma OCT Monitoring Guide: From Detection to Long-Term Care
Table of Contents
- Glaucoma detection: why early diagnosis is critical
- How to detect glaucoma in early stages: key approaches
- Advanced imaging for glaucoma: OCTA
- OCT glaucoma monitoring after diagnosis
- Additional tools for monitoring glaucoma treatment
- Glaucoma OCT: the foundation of long-term glaucoma care
Optical Coherence Tomography (OCT) has fundamentally changed glaucoma diagnostics over the past two decades. It enables non-invasive, micron-level imaging of retinal microstructures and provides objective measurements of the retinal nerve fibre layer (RNFL), ganglion cell complex (GCC), and optic nerve head (ONH) parameters. Moreover, the advent of OCT angiography (OCTA) has introduced a new dimension in assessing microcirculation—complementing structural analysis and potentially predicting glaucoma progression.
Today, OCT is the standard for early detection, monitoring, and risk stratification of glaucoma progression, as recognised in international clinical guidelines. When combined with functional tests, tonometry, and anterior chamber angle assessment, OCT becomes the foundation for personalised glaucoma management.
Glaucoma detection: why early diagnosis is critical
Early glaucoma diagnosis is vital, as optic nerve damage caused by the disease is irreversible. Many patients seek care only after significant vision loss has occurred, at which point treatment may slow progression but cannot restore lost function. This is why ophthalmologists emphasise the importance of glaucoma detection at preclinical or pre-perimetric stages.
How does OCT help in early glaucoma detection?
OCT provides high-resolution imaging of the retina and optic nerve head. Unlike subjective functional tests, OCT delivers objective, quantitative data on ganglion cells, nerve fibre layers, and the neuroretinal rim, enabling recognition of even subtle structural changes.
Recent OCT models go further, allowing detailed visualisation of the lamina cribrosa, a structure known to be altered in glaucoma. Today, OCT is recognised as a key diagnostic tool in the guidelines of both the European Glaucoma Society and the American Academy of Ophthalmology.
How to detect glaucoma in early stages: key approaches
Early glaucoma detection relies on evaluating structural and functional parameters of the eye, supported by advanced imaging techniques. The three main parameters assessed with glaucoma OCT are:
- Ganglion Cell Complex (GCC) thickness and asymmetry
- Retinal Nerve Fibre Layer (RNFL) thickness
- Optic nerve head parameters with the DDLS scale
In addition, OCT Angiography (OCTA) provides complementary insights into ocular microvasculature that may indicate early glaucomatous damage.
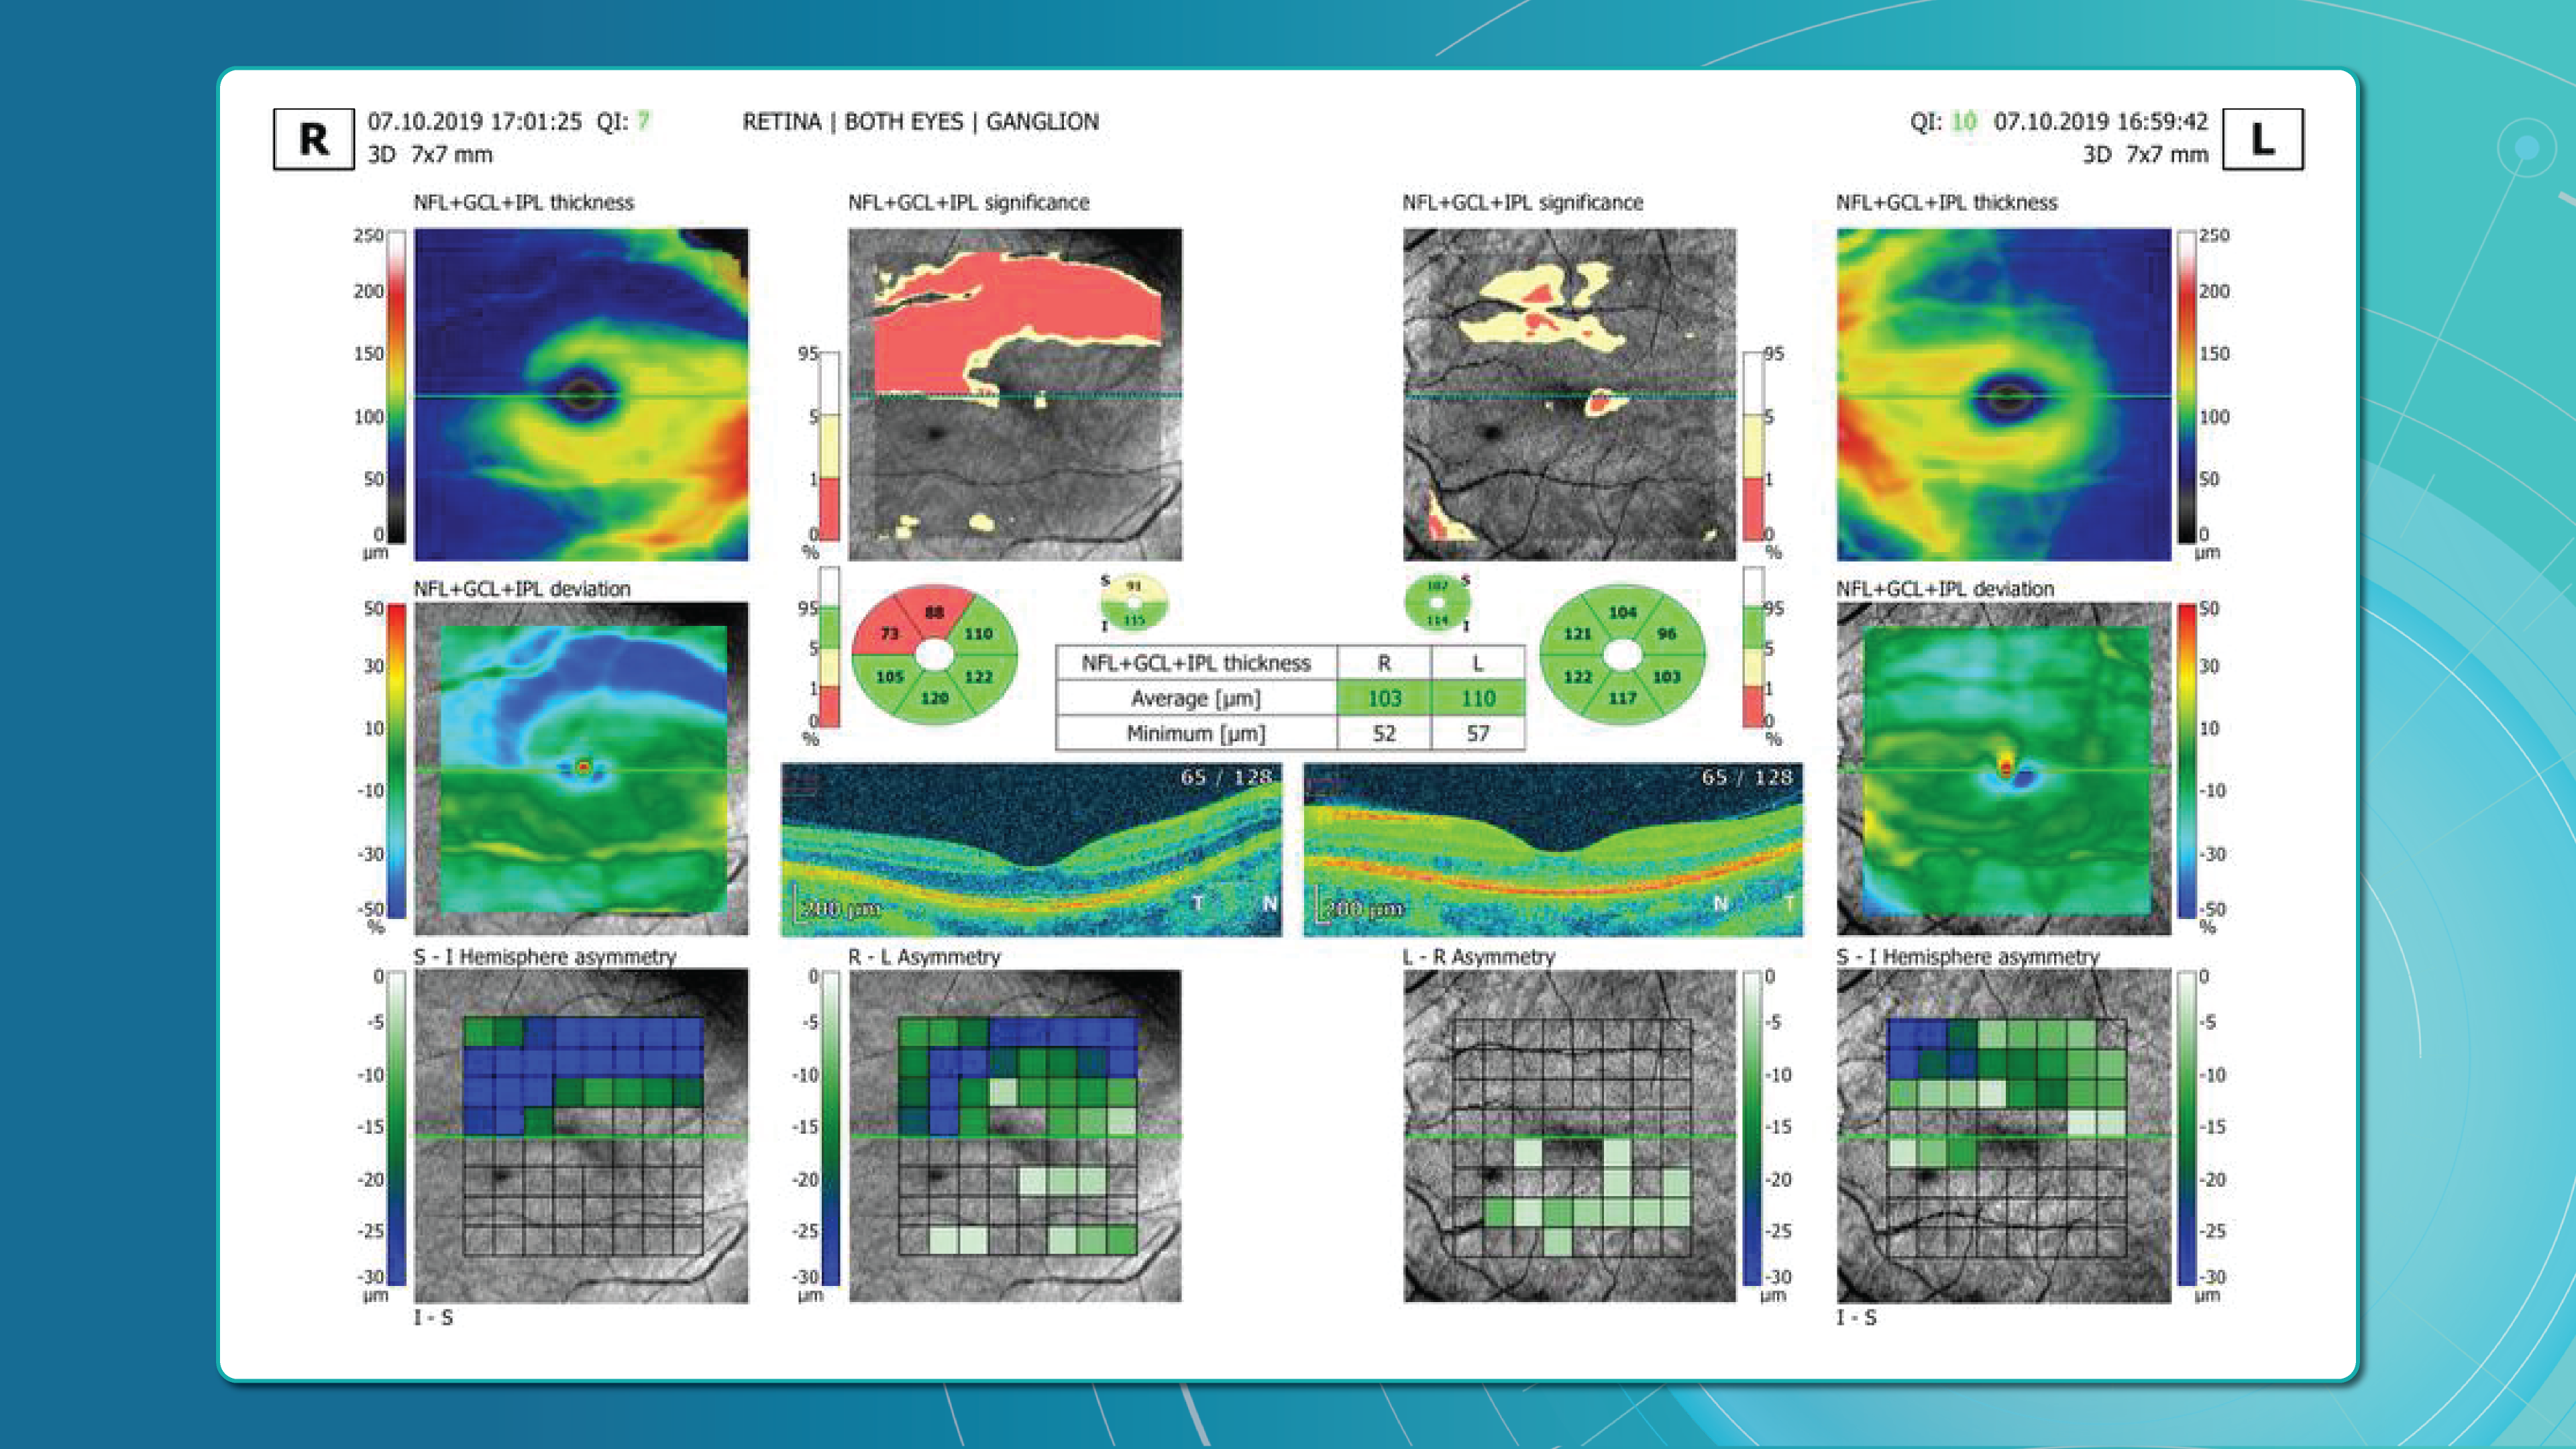
Glaucoma detection parameter 1: GCC thickness and asymmetry
One of the most sensitive preclinical biomarkers of glaucomatous damage is thinning of the ganglion cell complex (GCC), which includes the ganglion cell layer (GCL), inner plexiform layer (IPL), and macular RNFL (mRNFL). It is assessed through macular OCT scans. Damage in this area is particularly critical, as 50–60% of all ganglion cells are concentrated within the central 6 mm zone.
Assessing asymmetry between the superior and inferior halves of the macula within the GCC is a key diagnostic indicator. Studies show that minimum GCC thickness and FLV/GLV indices (Focal Loss Volume / Global Loss Volume) are predictors of future RNFL thinning or emerging visual field defects. Asymmetry maps significantly ease clinical interpretation.
A newer approach—vector analysis of GCC loss—also allows clinicians to visualise the direction of damage, which often correlates with future visual field defects.
Glaucoma detection parameter 2: RNFL thickness analysis
RNFL analysis is among the most widely used glaucoma diagnostic methods. The RNFL reflects the axons of the ganglion cells and is readily measured in optic nerve scans. Temporal sectors are the most sensitive and often show the earliest changes.
Even when the overall thickness appears normal, localised defects should raise suspicion. Sectoral thinning of ≥5–7 μm is considered statistically significant. Age-related RNFL decline (~0.2–0.5 μm/year) must also be considered.
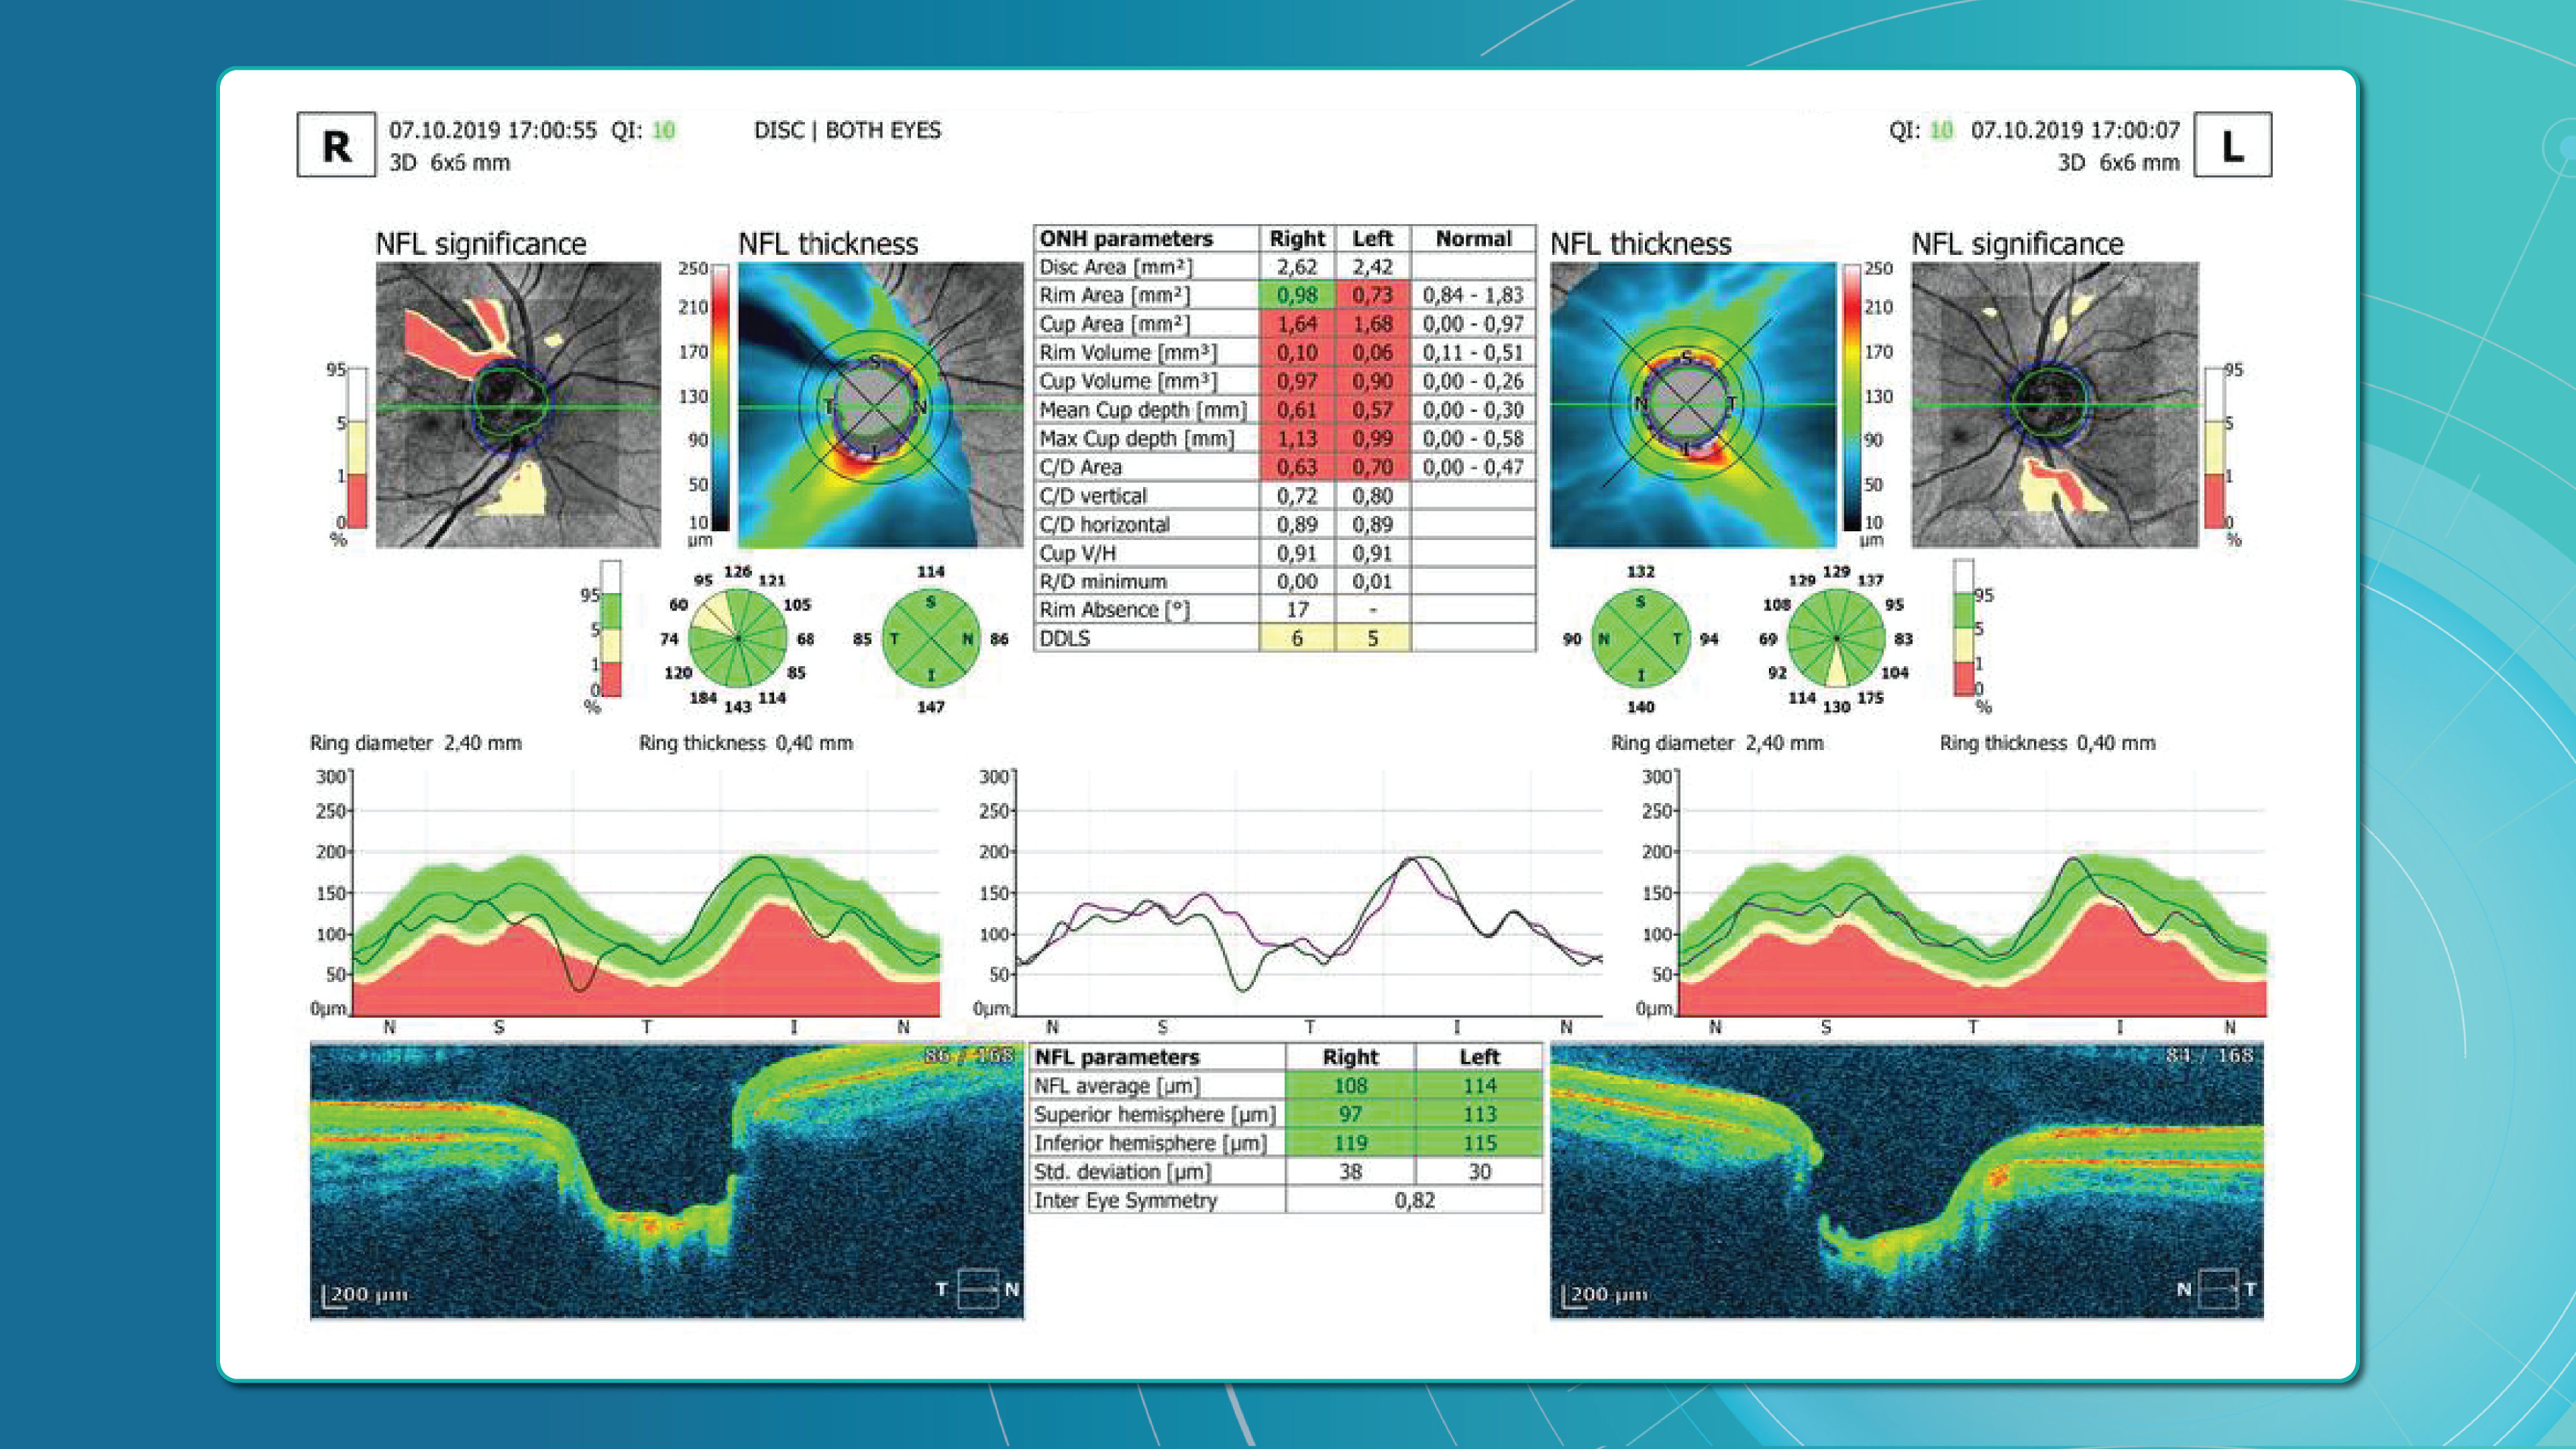
Glaucoma detection parameter 3: optic nerve head parameters and the DDLS scale
Evaluating the optic nerve head (ONH) is essential. OCT enables automated assessment of optic disc area, cup-to-disc ratio (C/D), cup volume, rim area, and the lamina cribrosa.
The Disc Damage Likelihood Scale (DDLS) classifies glaucomatous ONH changes based on the thinnest radial rim width or, if absent, the extent of rim loss. Unlike the C/D ratio, DDLS adjusts for disc size. When combined with OCT, DDLS significantly enhances objective clinical assessment.
In high myopia, automatic ONH segmentation often misclassifies anatomy. Here, newer deep learning–based segmentation models improve accuracy.
Advanced imaging for glaucoma: OCTA
OCT Angiography (OCTA), an advanced glaucoma OCT technique, provides unique insights into ocular circulation. It enables evaluation of:
- Vessel density in the peripapillary region
- Optic nerve and macular vascularisation
- Retinal versus ONH perfusion in both eyes
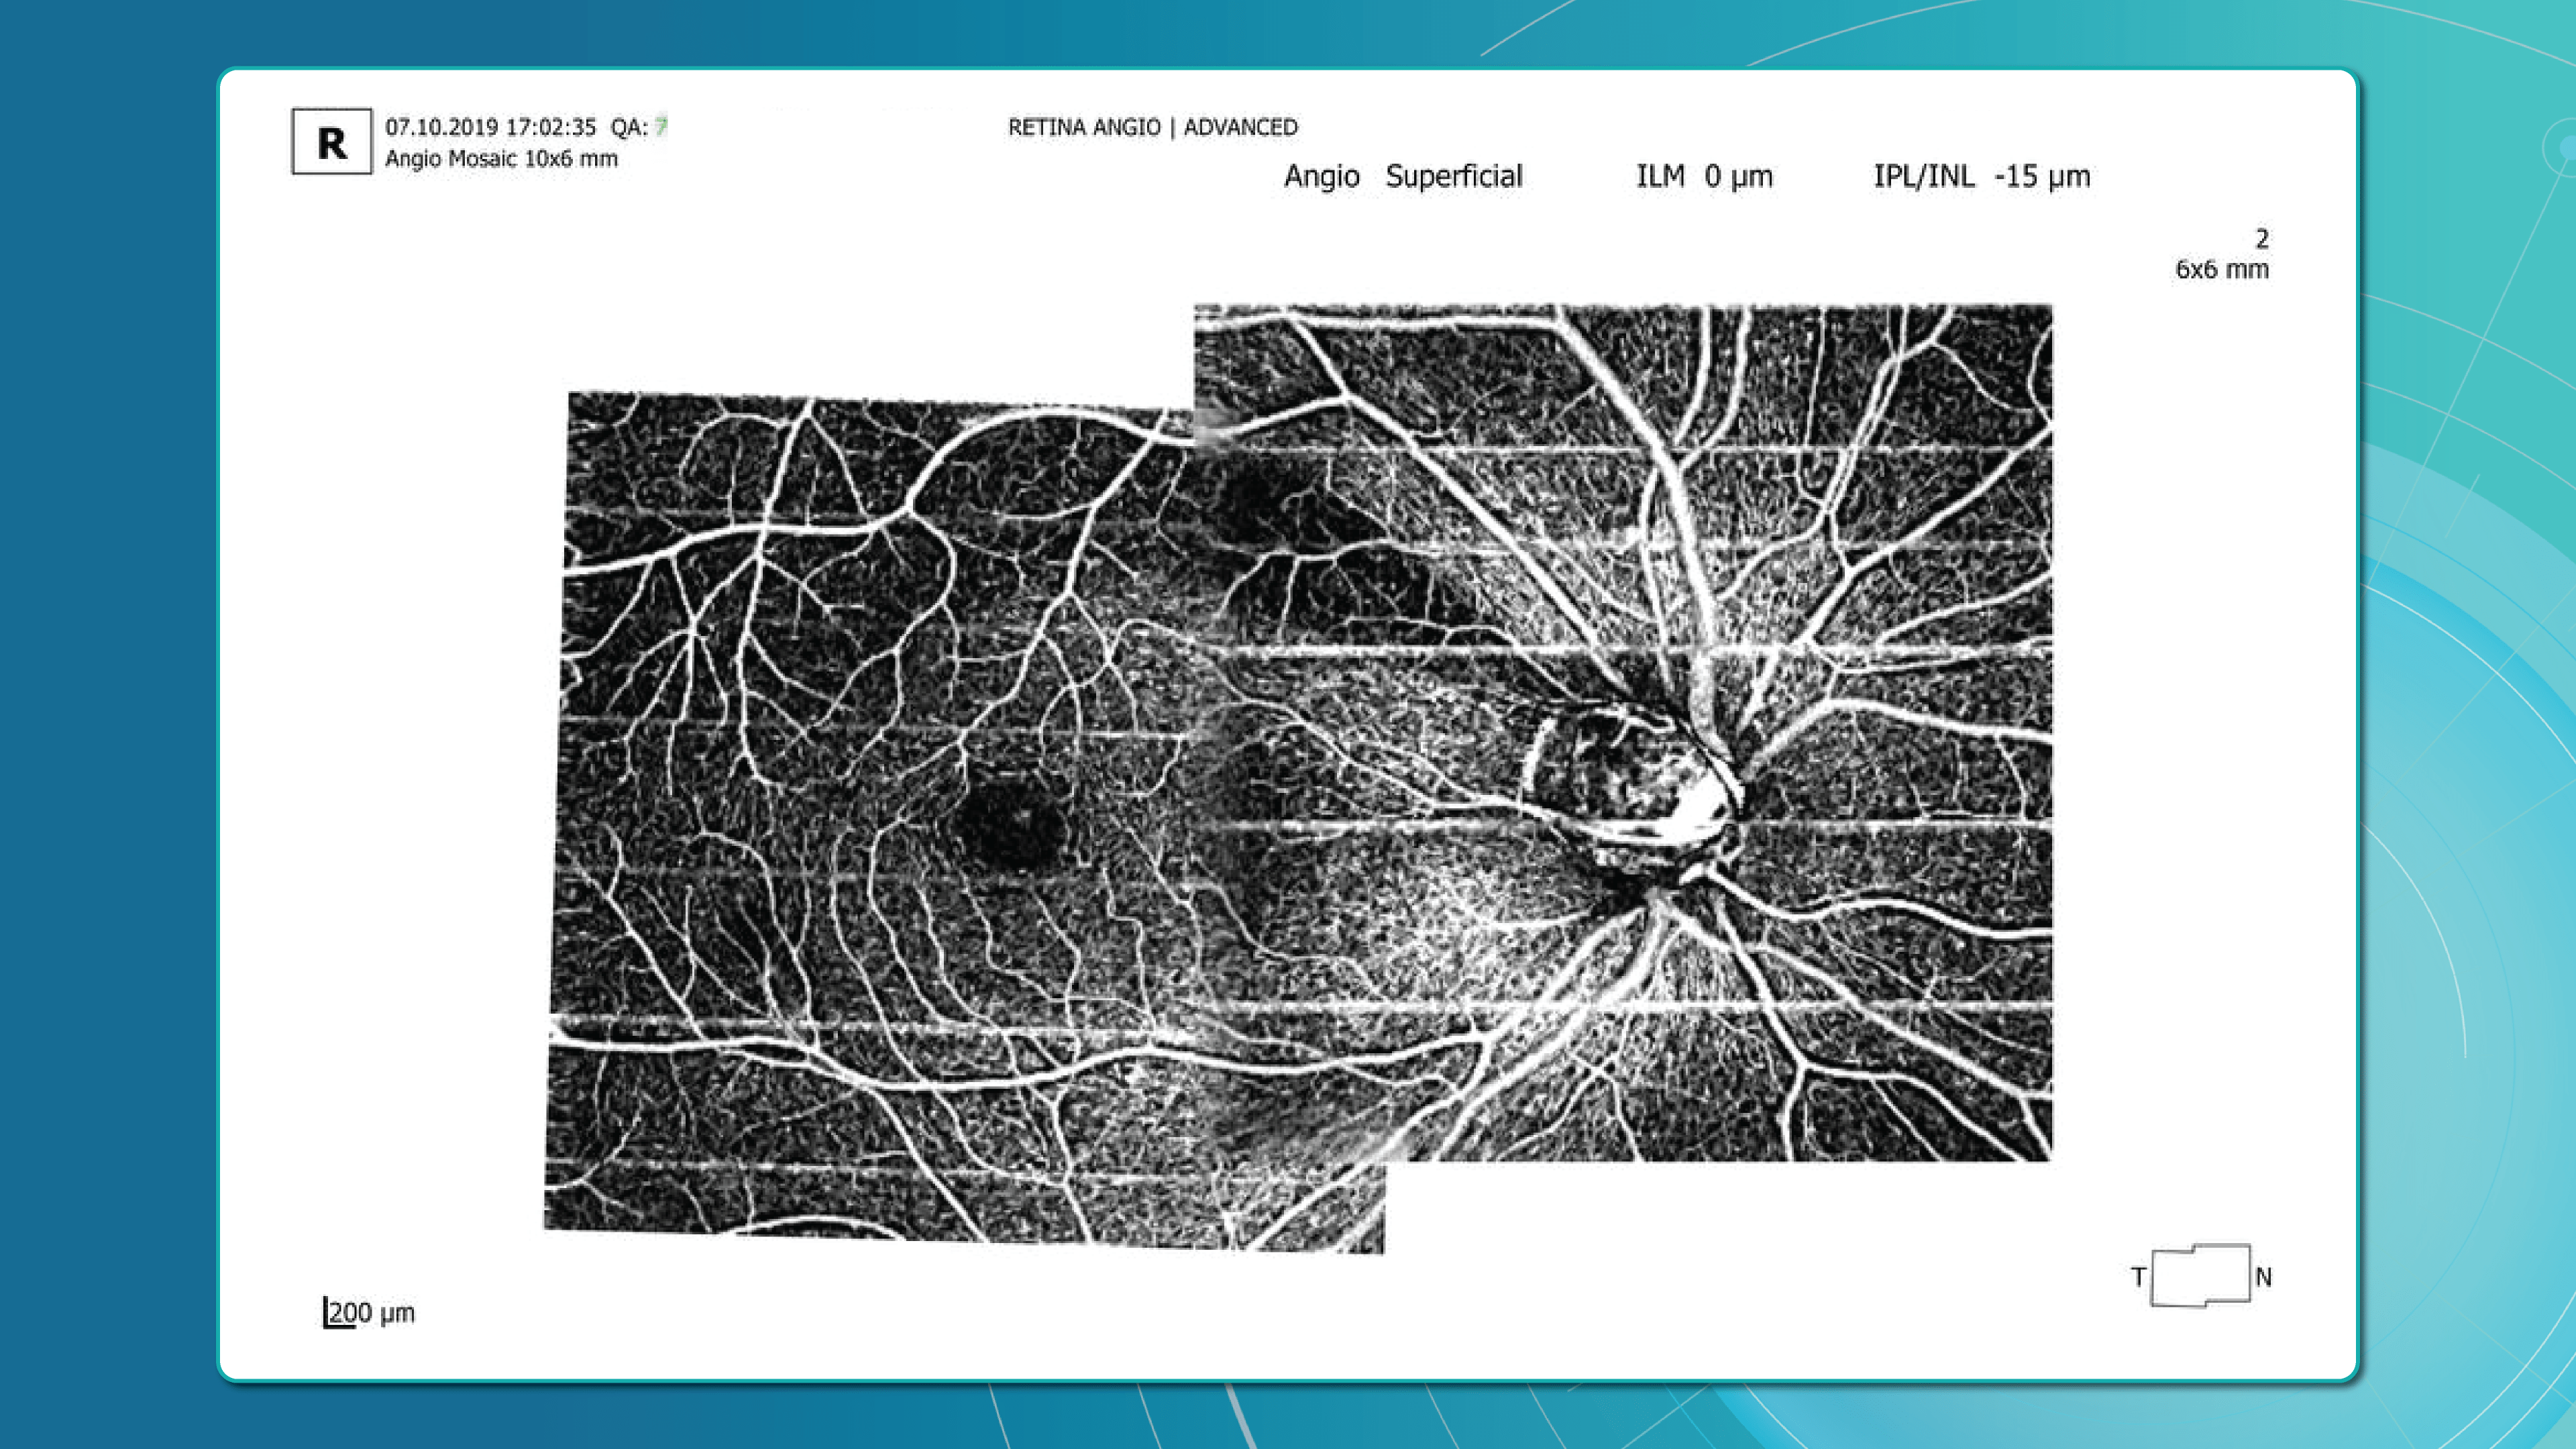
Studies confirm that reduced vessel density correlates with RNFL loss and visual field deterioration, and often precedes both.
OCT glaucoma monitoring after diagnosis
Glaucoma can progress even with stable intraocular pressure (IOP), making regular structural assessment of the optic nerve and inner retina crucial for therapy adjustment.
Glaucoma OCT is not only a diagnostic tool but also the primary method for monitoring glaucomatous damage. Unlike functional tests, OCT can detect even minimal RNFL or GCL thinning months or even years before visual field loss appears. With serial measurements and built-in analytics, OCT allows clinicians to track glaucoma progression rates and identify high-risk patients.
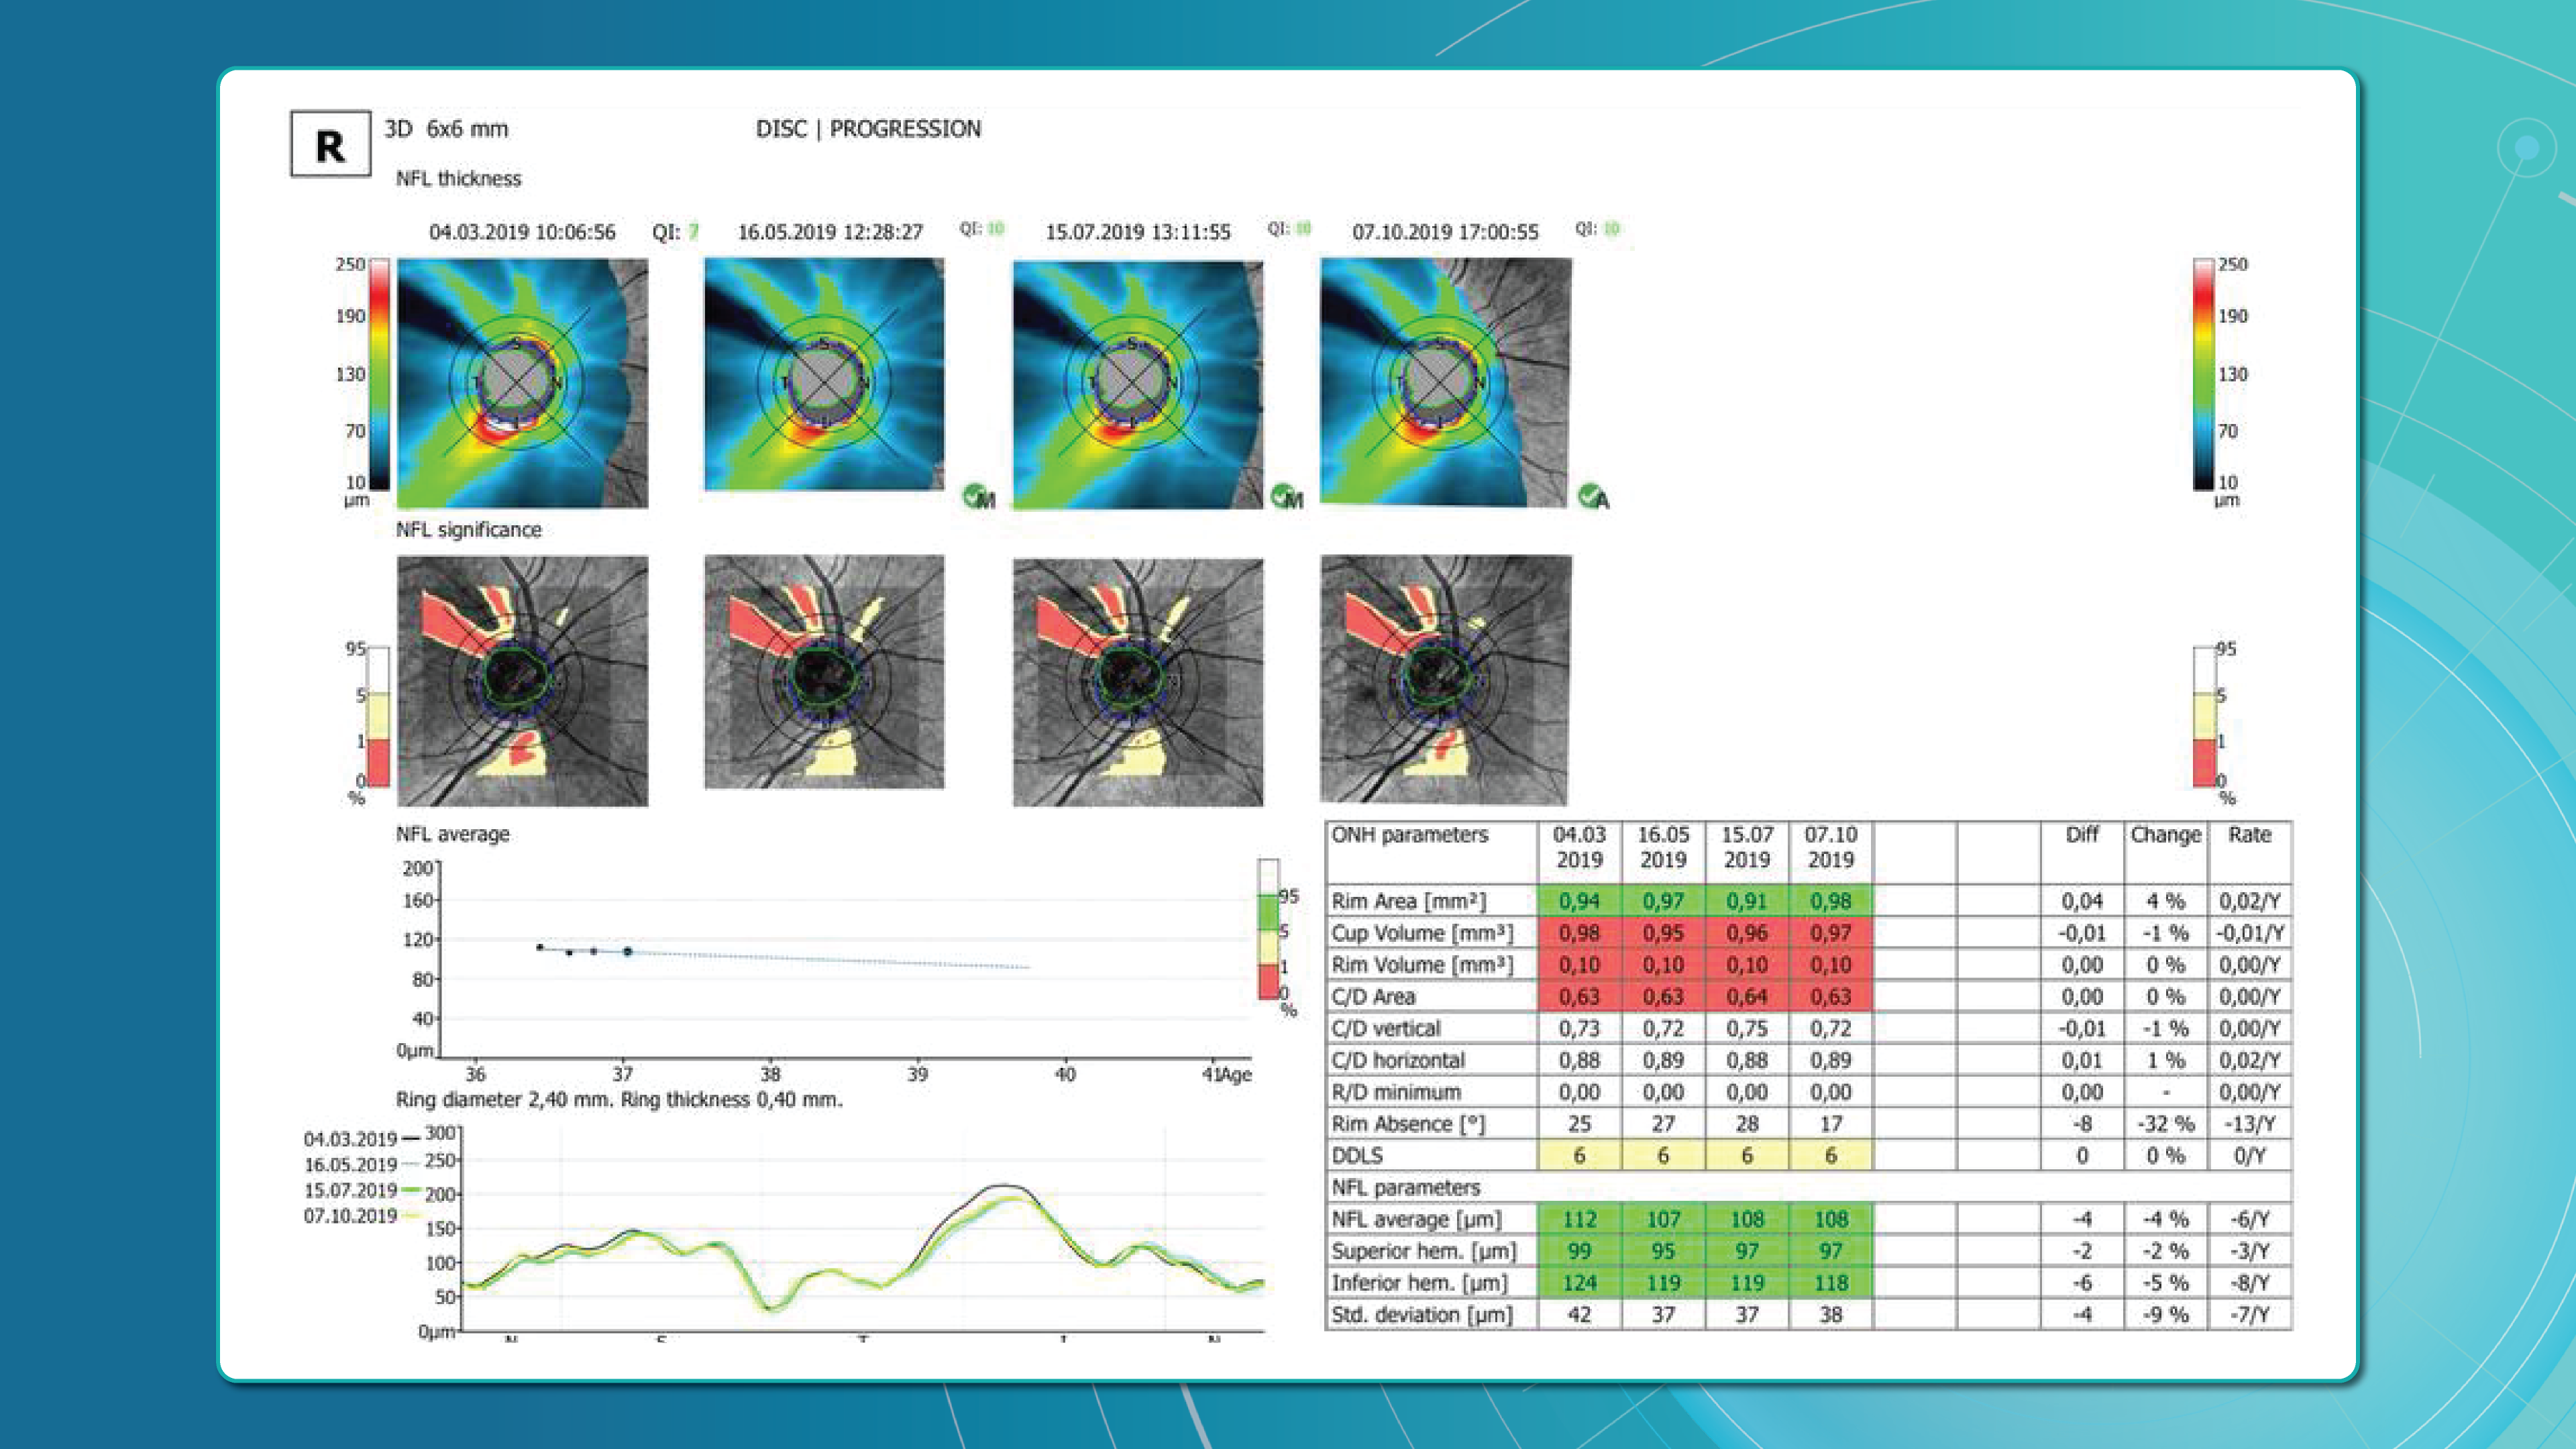
Methods for glaucoma progression monitoring
There are two main approaches to monitoring glaucoma progression with OCT:
Method 1: event-based analysis
This method compares current scans with a reference baseline, identifying whether RNFL or GCL thinning exceeds expected variability.
? Example: Heidelberg Eye Explorer (HEYEX) highlights suspicious areas in yellow (possible loss) or red (confirmed loss).
Limitations include sensitivity to artifacts, image misalignment, and segmentation quality. A high-quality baseline scan is essential.
Method 2: trend-based analysis
This approach accounts for time. The software plots RNFL/GCL thickness trends over time in selected sectors or globally and calculates the rate of progression.
Examples:
- RNFL thinning >1.0 μm/year is clinically significant.
- Thinning >1.5 μm/year indicates active progression.
It also accounts for age-related changes, helping differentiate physiological vs. pathological decline.
Visual assessment in glaucoma OCT
Qualitative analysis also plays an important role in detecting glaucoma progression. Key aspects include:
- Focal RNFL thinning (localised defects)
- Changes in the neuroretinal rim
- Alterations in ONH cupping
- GCL/GCIPL comparison (superior vs. inferior) on macular maps
- New segmentation artifacts (may mimic progression)
OCT glaucoma findings that indicate true progression
Five OCT findings suggest true glaucomatous progression:
- RNFL thinning >10 μm in one sector or >5 μm in several sectors
- New or worsening GCL asymmetry (yellow to red colour shift)
- Emerging or expanding RNFL defects on colour maps
- Increasing C/D ratio with concurrent rim thinning
- New localised areas of vessel density loss on OCTA
Particular attention should be paid to the inferotemporal and superotemporal RNFL sectors, where 80% of early changes occur.
Frequency of glaucoma OCT monitoring
According to the AAO and EGS, the recommended frequency for OCT glaucoma monitoring is:
- High-risk patients: every 6 months
- Stable patients: once a year
- For trend analysis: at least 6–8 scans over 2 years to ensure statistical reliability
Looking ahead, broader use of AI for glaucoma is expected to support earlier and more accurate detection, while also reducing false positives.
Additional tools for monitoring glaucoma treatment
While glaucoma OCT is essential for detecting structural changes, a comprehensive glaucoma assessment requires a multimodal approach. Additional tools include perimetry, tonometry, optic disc fundus photography, and gonioscopy.
Perimetry (visual field testing)
Functional assessment of the optic nerve remains crucial. Standard Automated Perimetry (SAP), most often performed with Humphrey Visual Field Analyzer protocols (24-2, 30-2, 10-2), is the most widely used method.
Key indices:
- MD (mean deviation): average deviation from normal values
- PSD (pattern standard deviation): highlights localised defects
- VFI (visual field index): summarises global visual function; useful for tracking glaucoma progression
- GHT (glaucoma hemifield test): automated analysis of field asymmetry
? Important: In 30–50% of cases, structural changes such as RNFL thinning on OCT precede visual field defects; in others, functional loss appears first. Best practice relies on integrated OCT and perimetry to correlate damage location and monitor glaucoma progression more precisely.
Combined OCT and perimetry remains the gold standard for progression monitoring.
Tonometry
Intraocular pressure (IOP) is the only clearly modifiable risk factor associated with both glaucoma onset and progression.
- Goldmann applanation tonometry remains the gold standard.
- A single IOP reading is insufficient — diurnal fluctuations are an independent risk factor, particularly in normal-tension glaucoma.
Optic disc fundus photography
Although subjective, fundus imaging remains valuable for documenting glaucomatous changes, especially in borderline cases. Unlike OCT, it does not provide quantitative data but helps visualise morphology over time.
What to assess:
- Progressive disc cupping
- Changes in neuroretinal rim shape or colour
- Disc margin haemorrhages (linked to faster RNFL thinning and visual field loss)
- Inter-eye comparisons
Gonioscopy
Gonioscopy evaluates the anterior chamber angle and helps exclude angle-closure, pigmentary, or pseudoexfoliative glaucoma. It also identifies:
- Neovascularisation
- Trabecular meshwork abnormalities
- Other angle anomalies
Patient education: a key to successful glaucoma management
Accurate glaucoma detection and therapy are not enough; adherence to monitoring and treatment is equally critical.
The challenge:
- Early-stage glaucoma is asymptomatic.
- Many patients underestimate its seriousness, leading to poor compliance, missed follow-ups, and discontinuation of therapy.
The goals of patient education:
- Explain that glaucoma progresses silently but can lead to irreversible blindness if untreated.
- Use real-life examples (before/after OCT scans, visual field comparisons) to illustrate progression.
- Teach patients to recognise warning signs (vision changes, eye pain).
- Visualise disease progression with AI tools showing RNFL loss and future risk.
Educational resources may include:
- Printed brochures in patient-friendly language
- Videos featuring OCT images with explanations
- Doctor–patient in-clinic discussions
- Telemedicine platforms with reminders and follow-up prompts
According to the AAO, patients who understand glaucoma are 2.5 times more likely to adhere to treatment and attend check-ups.
Glaucoma OCT: the foundation of long-term glaucoma care
Glaucoma OCT now plays a central role in both diagnosis and monitoring. Its ability to detect subtle structural changes before measurable functional loss makes early intervention possible and increases the chances of preserving vision.
But technology alone is not enough. Accurate interpretation, combined with strong patient education, is essential. When patients understand their disease and the role of glaucoma OCT in treatment, adherence improves and outcomes are better.
OCT is not just a diagnostic device; it is the cornerstone of an integrated glaucoma management strategy, from initial screening to long-term monitoring and treatment optimisation.
Disclaimer: USA FDA 510(k) Class II; Altris Image Management System (Altris IMS); AI/ML models and components intended to use for research purposes only, not for clinical diagnosis purposes.